1.2 — Measuring Development
ECON 317 • Economic Development • Fall 2021
Ryan Safner
Assistant Professor of Economics
safner@hood.edu
ryansafner/devF21
devF21.classes.ryansafner.com
Is There Such a Thing as "Political Development"?
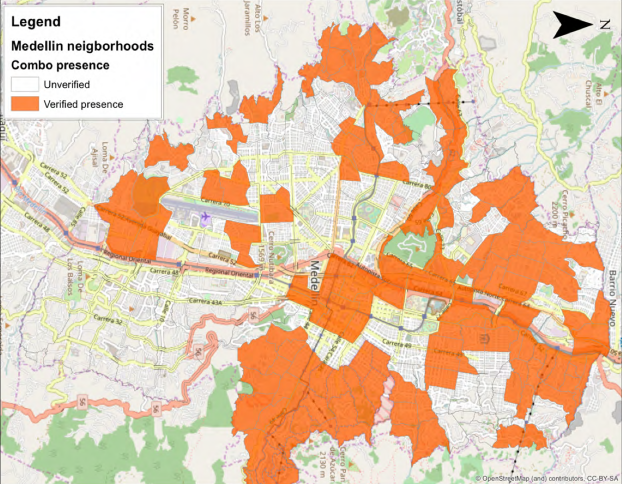
Example 1: Life in Medellin, Colombia I
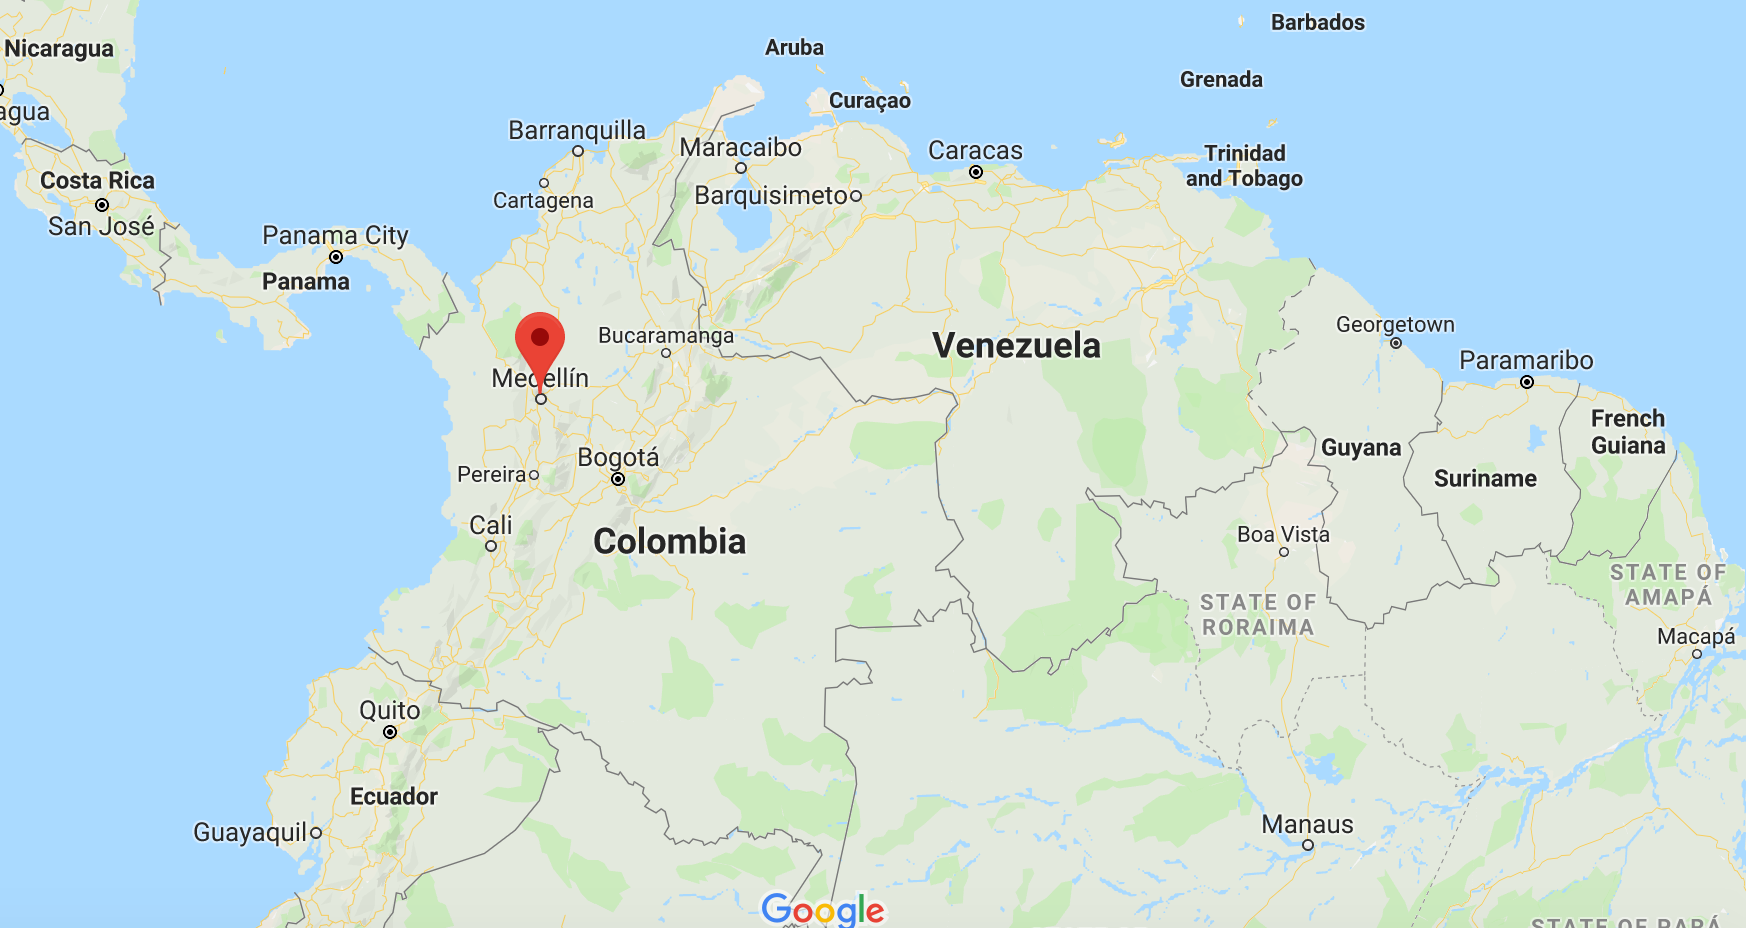
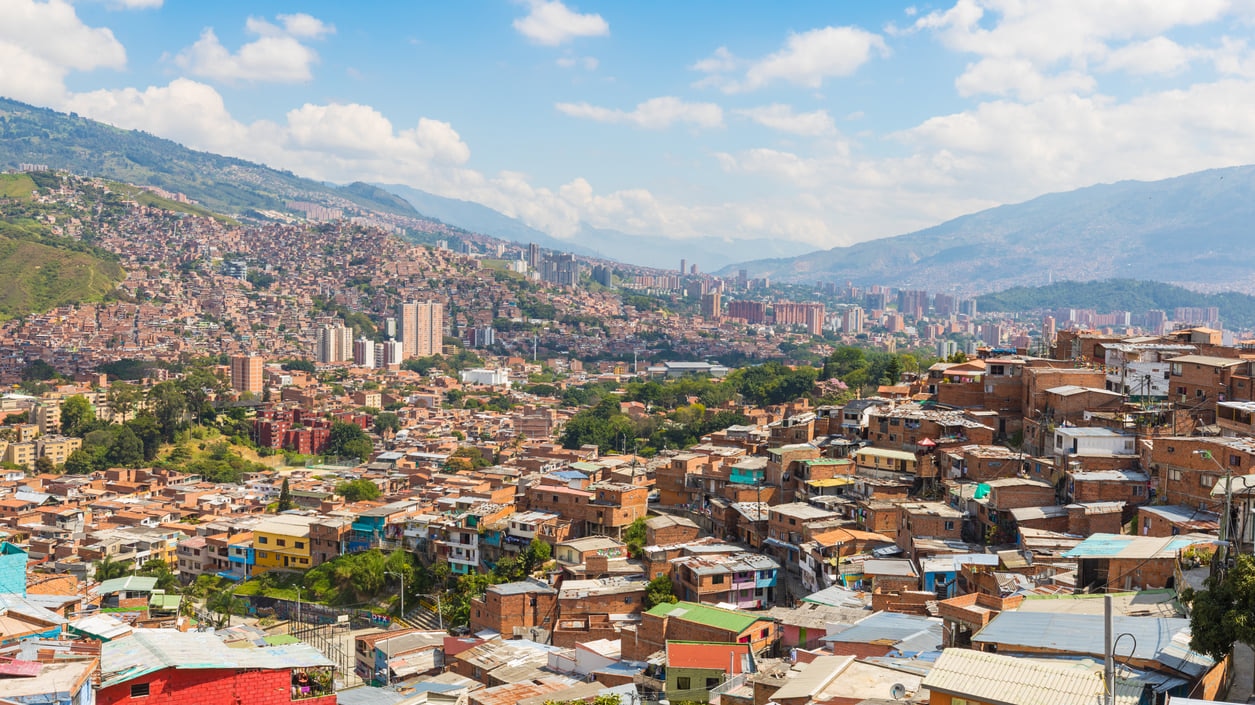
Blattman, Christopher, Gustavo Duncan, Benjamin Lessing, and Santiago Tobon, 2019, "Gangs of Medellin: How Organized Crime is Organized," Working Paper
Example 1: Life in Medellin, Colombia II
- Historically, weak State presence into peripheries
- Hillsides full of displaced people, immigrants, poor
- Limited access to public goods (police, courts, services, etc)

Blattman, Christopher, Gustavo Duncan, Benjamin Lessing, and Santiago Tobon, 2019, "Gangs of Medellin: How Organized Crime is Organized," Working Paper
Example 1: Life in Medellin, Colombia III
- More than 300 local youth gangs
- Began in low income neighborhoods
- with business in illicit trade:
- Protection rackets
- Local trafficking
- Moneylending, loan sharking
- Voter "mobilization"

Blattman, Christopher, Gustavo Duncan, Benjamin Lessing, and Santiago Tobon, 2019, "Gangs of Medellin: How Organized Crime is Organized," Working Paper
Example 1: Life in Medellin, Colombia IV
- Gangs take on other "stately" roles:
- Adjudicating disputes, enforcing property rights
- Police against (outside) thieves
- Local employment programs
- Collecting "taxes" regularly
Blattman, Christopher, Gustavo Duncan, Benjamin Lessing, and Santiago Tobon, 2019, "Gangs of Medellin: How Organized Crime is Organized," Working Paper
Example 1: Life in Medellin, Colombia V
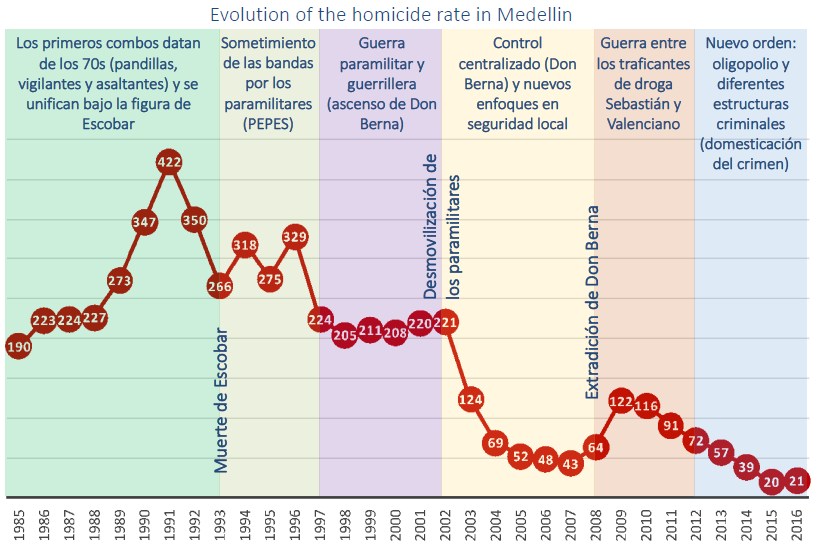
- Violence has been reduced and stabilized, with periodic flare ups
Blattman, Christopher, Gustavo Duncan, Benjamin Lessing, and Santiago Tobon, 2019, "Gangs of Medellin: How Organized Crime is Organized," Working Paper
Example 1: Life in Medellin, Colombia VI
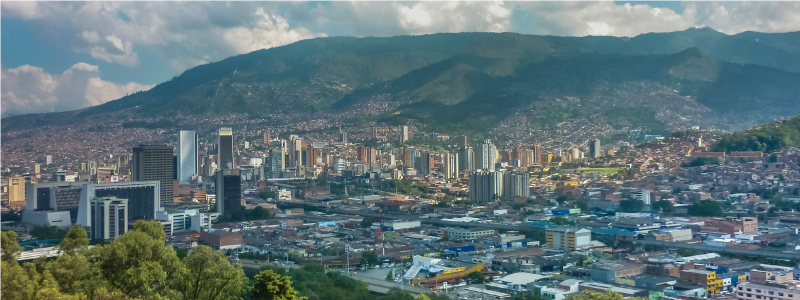
In what sense is Medellin "underdeveloped?"
Example 2: United States in the 18th-19th Century I
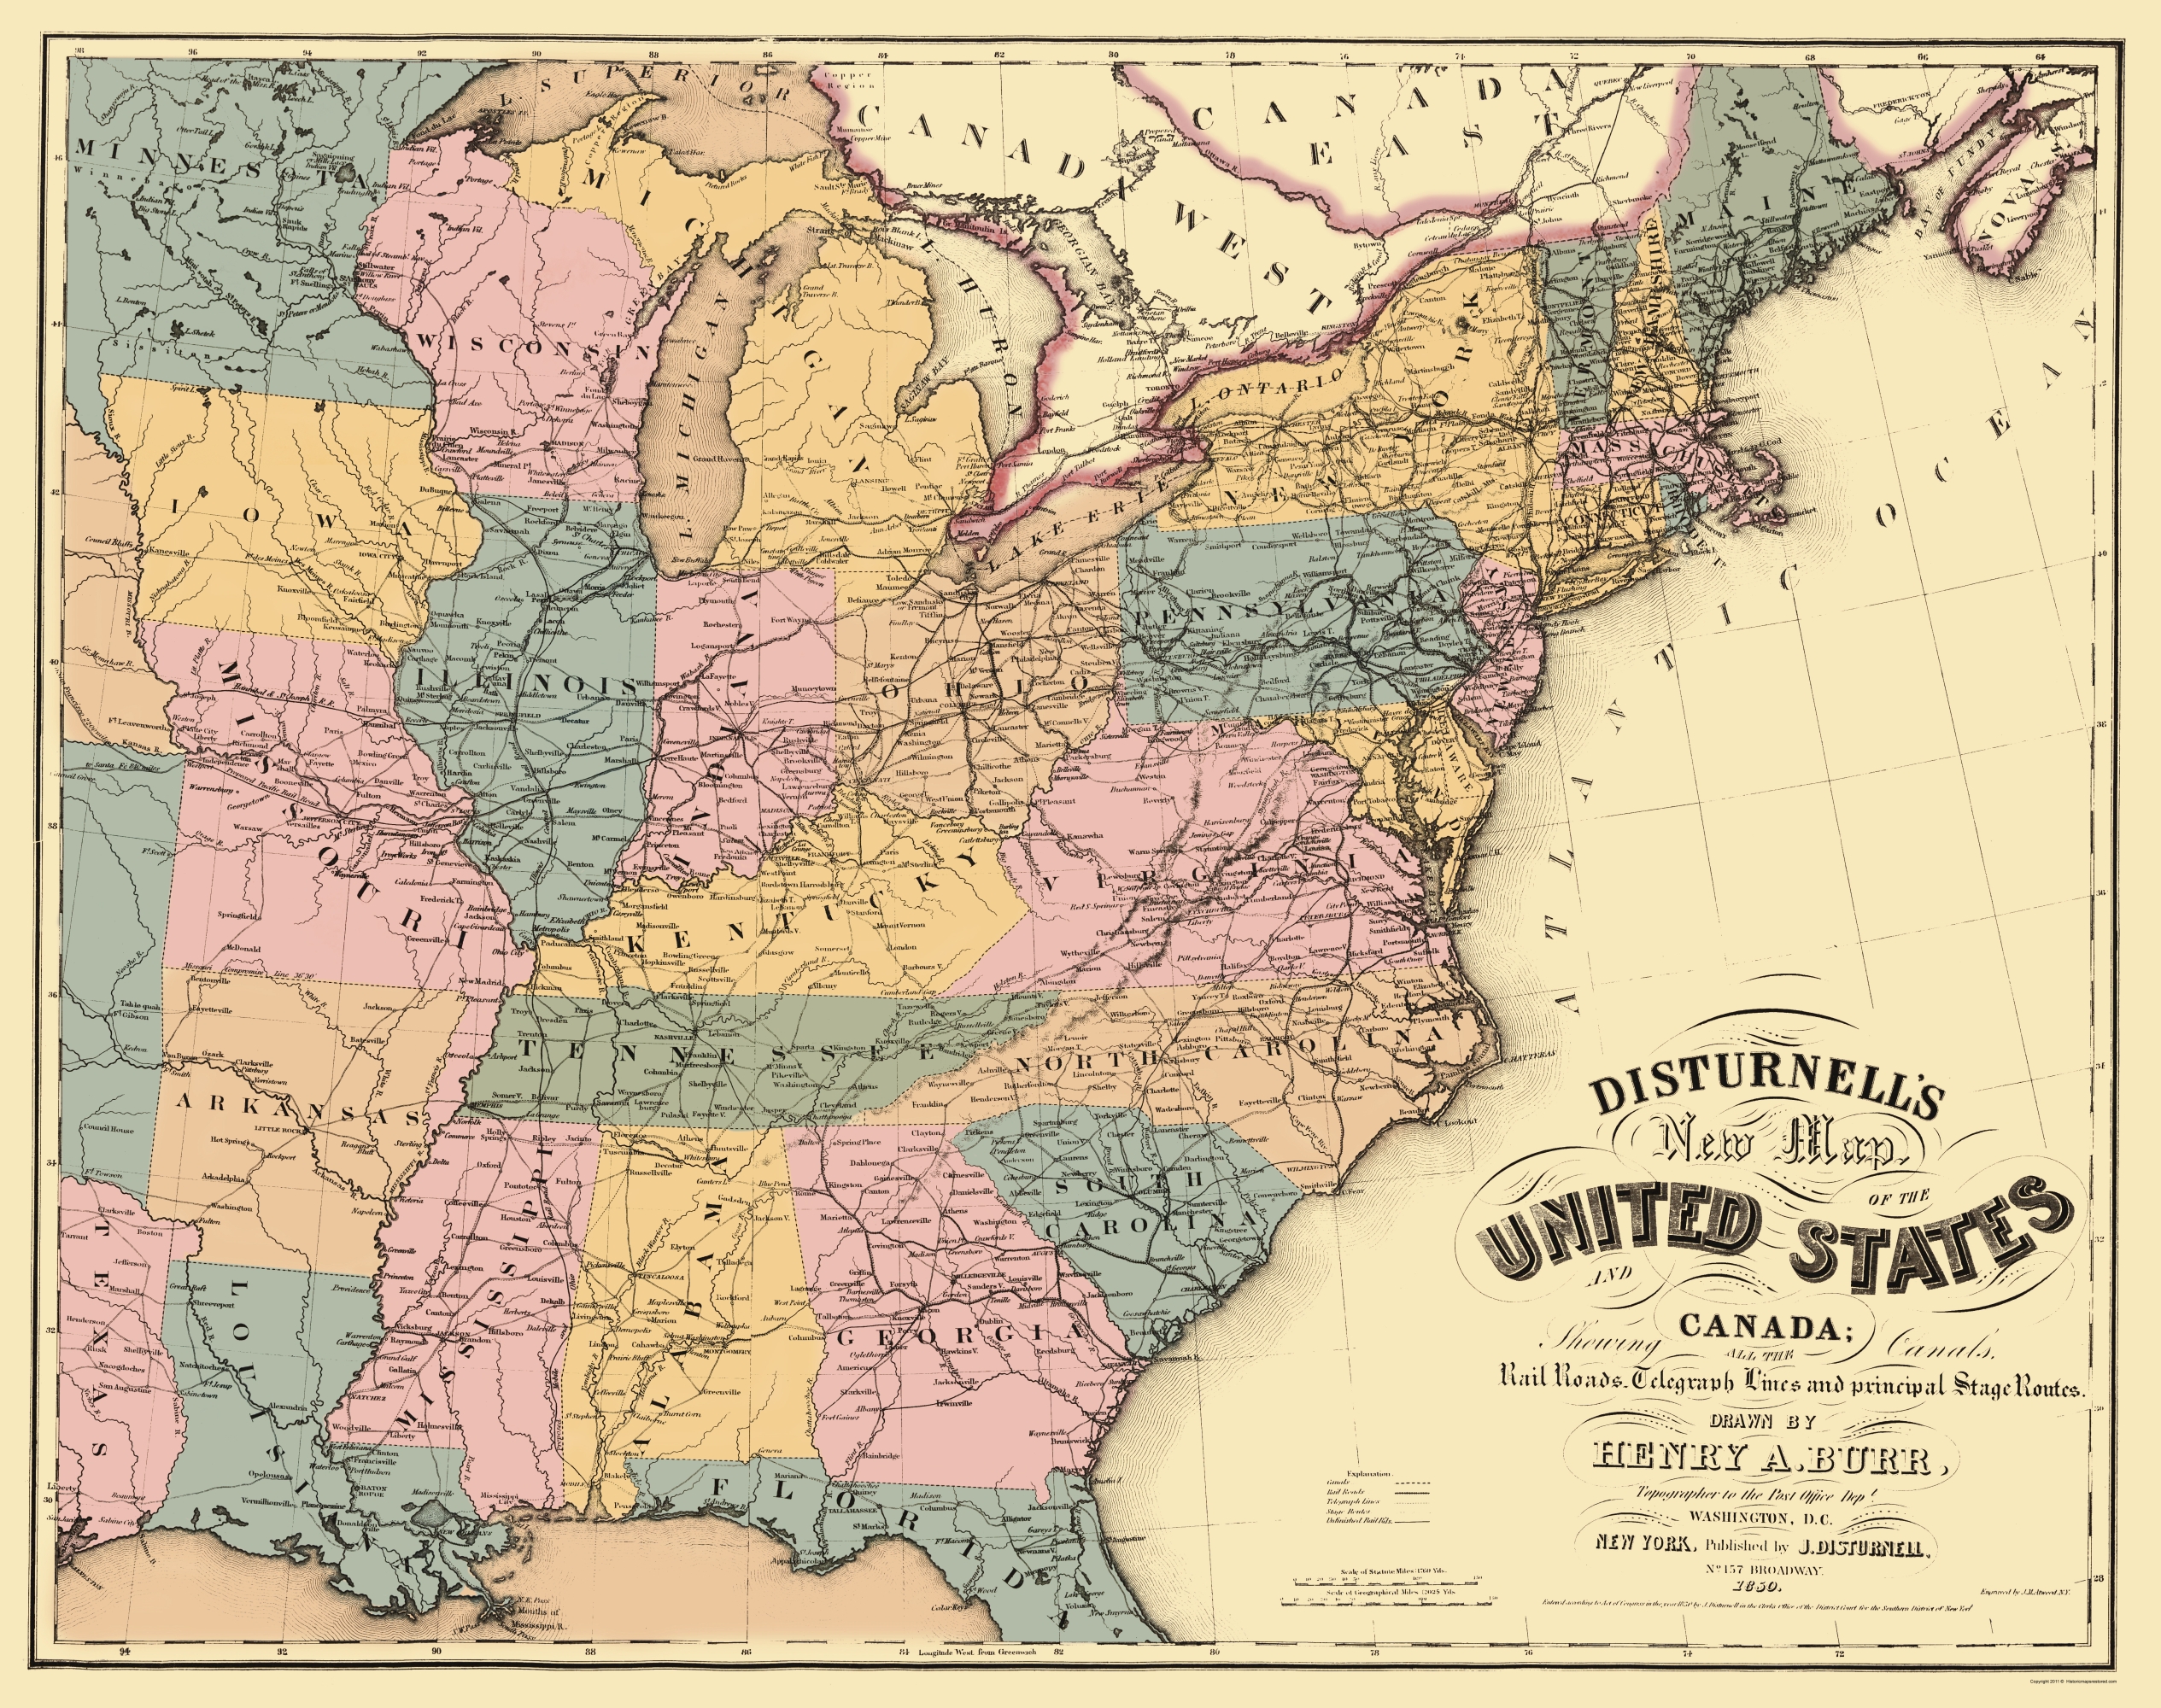
- On the one hand:
- Nation founded on principles that "all men are created equal" and endowed with "unalienable rights [to] life, liberty, and the pursuit of happiness"
- Vibrant "Town Hall" culture of civic participation in democracy and civil society
- de Tocqueville: Americans have mastered "the art of association"
Example 2: United States in the 18th-19th Century II
- On the other hand:
- Revolution was led by elite land-owners, merchants, and some slave-owners
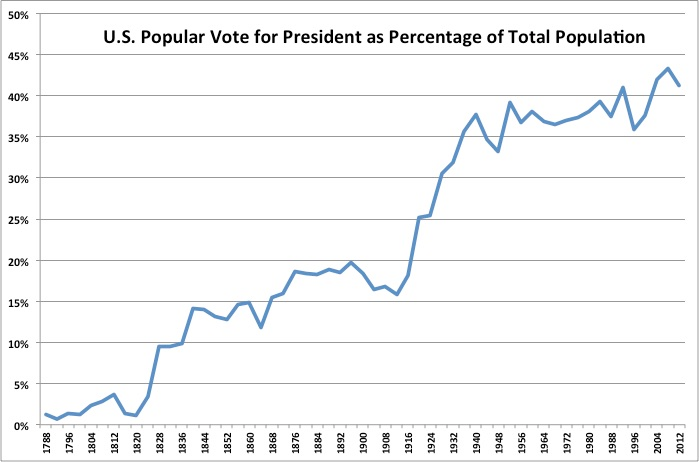
- Voting restricted to a small number of male property owners

Example 2: United States in the 18th-19th Century IV
U.S. States and Federal Government was clientelist1, no professional bureaucracy until the Pendelton Civil Service Reform Act of 1883
- Political parties delegated public offices to political allies
Cities governed by "political machines"
- Vote buying, fraud, intimidation
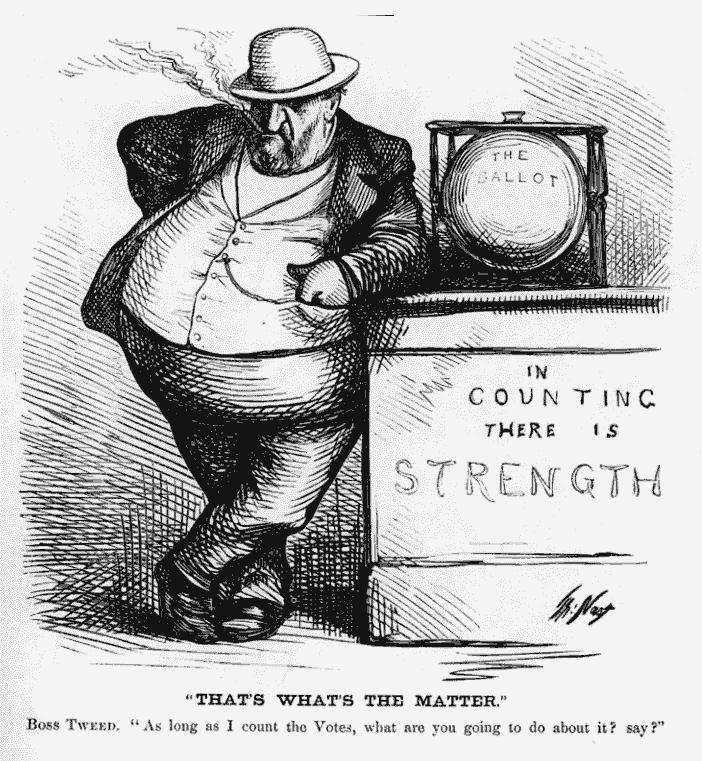
1 Also called "patronage" or "the spoils system".
Example 2: United States in the 18th-19th Century IV
Example 2: United States in the 18th-19th Century V

George Washington Plunkitt
1842-1924
EVERYBODY is talkin' these days about Tammany men growin' rich on graft, but nobody thinks of drawin' the distinction between honest graft and dishonest graft. There's all the difference in the world between the two. Yes, many of our men have grown rich in politics. I have myself. I've made a big fortune out of the game, and I'm gettin' richer every day, but I've not gone in for dishonest graft—blackmailin' gamblers, saloonkeepers, disorderly people, etc.—and neither has any of the men who have made big fortunes in politics.
There's an honest graft, and I'm an example of how it works. I might sum up the whole thing by sayin': "I seen my opportunities and I took 'em."
Plunkitt of Tammany Hall, Ch. 1
A Hypothesis to Consider
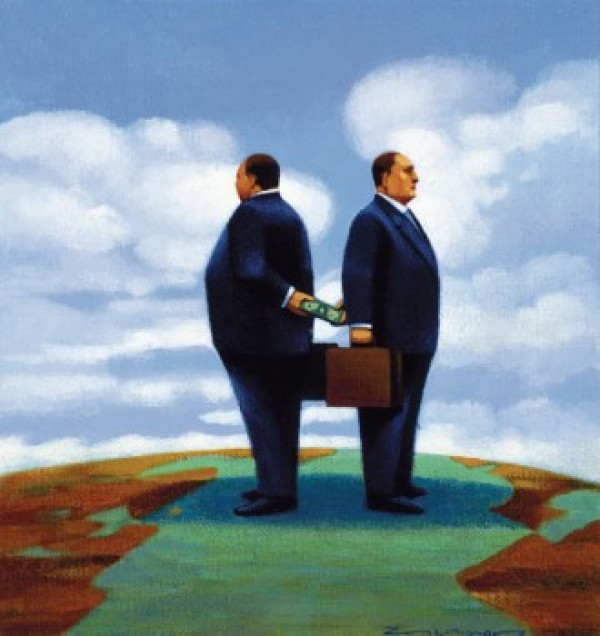
These are characteristics of "normal countries"
- Middle-income, still industrializing economies
- Endemic corruption, but can still be consistent with economic growth
- "honest graft vs. dishonest graft?"
Note: "normal" ≠ "good" or "just"!
Democratic, politically free countries with open access and low corruption are a very new thing historically!
Shleifer, Andrei and Daniel Treisman, 2005, "A Normal Country: Russia after Communism," Journal of Economic Perspectives 19(1): 151-174
Political Development and Economic Development I
Is a "developed country" politically developed?
What does that mean? Democracy?
Is democracy important for
- economic development?
- human flourishing?
- (how do those two concepts overlap?)
If not (or not only) democracy, then what?
state capacity

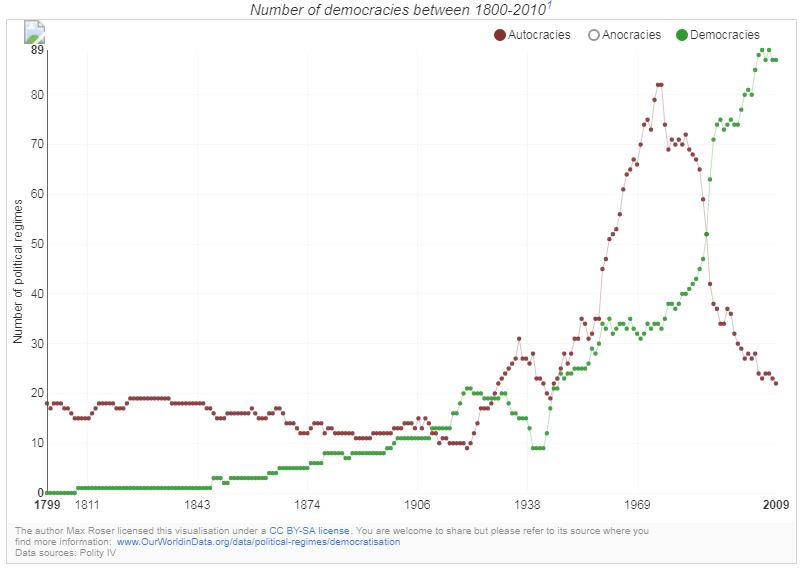
Political Development and Economic Development II
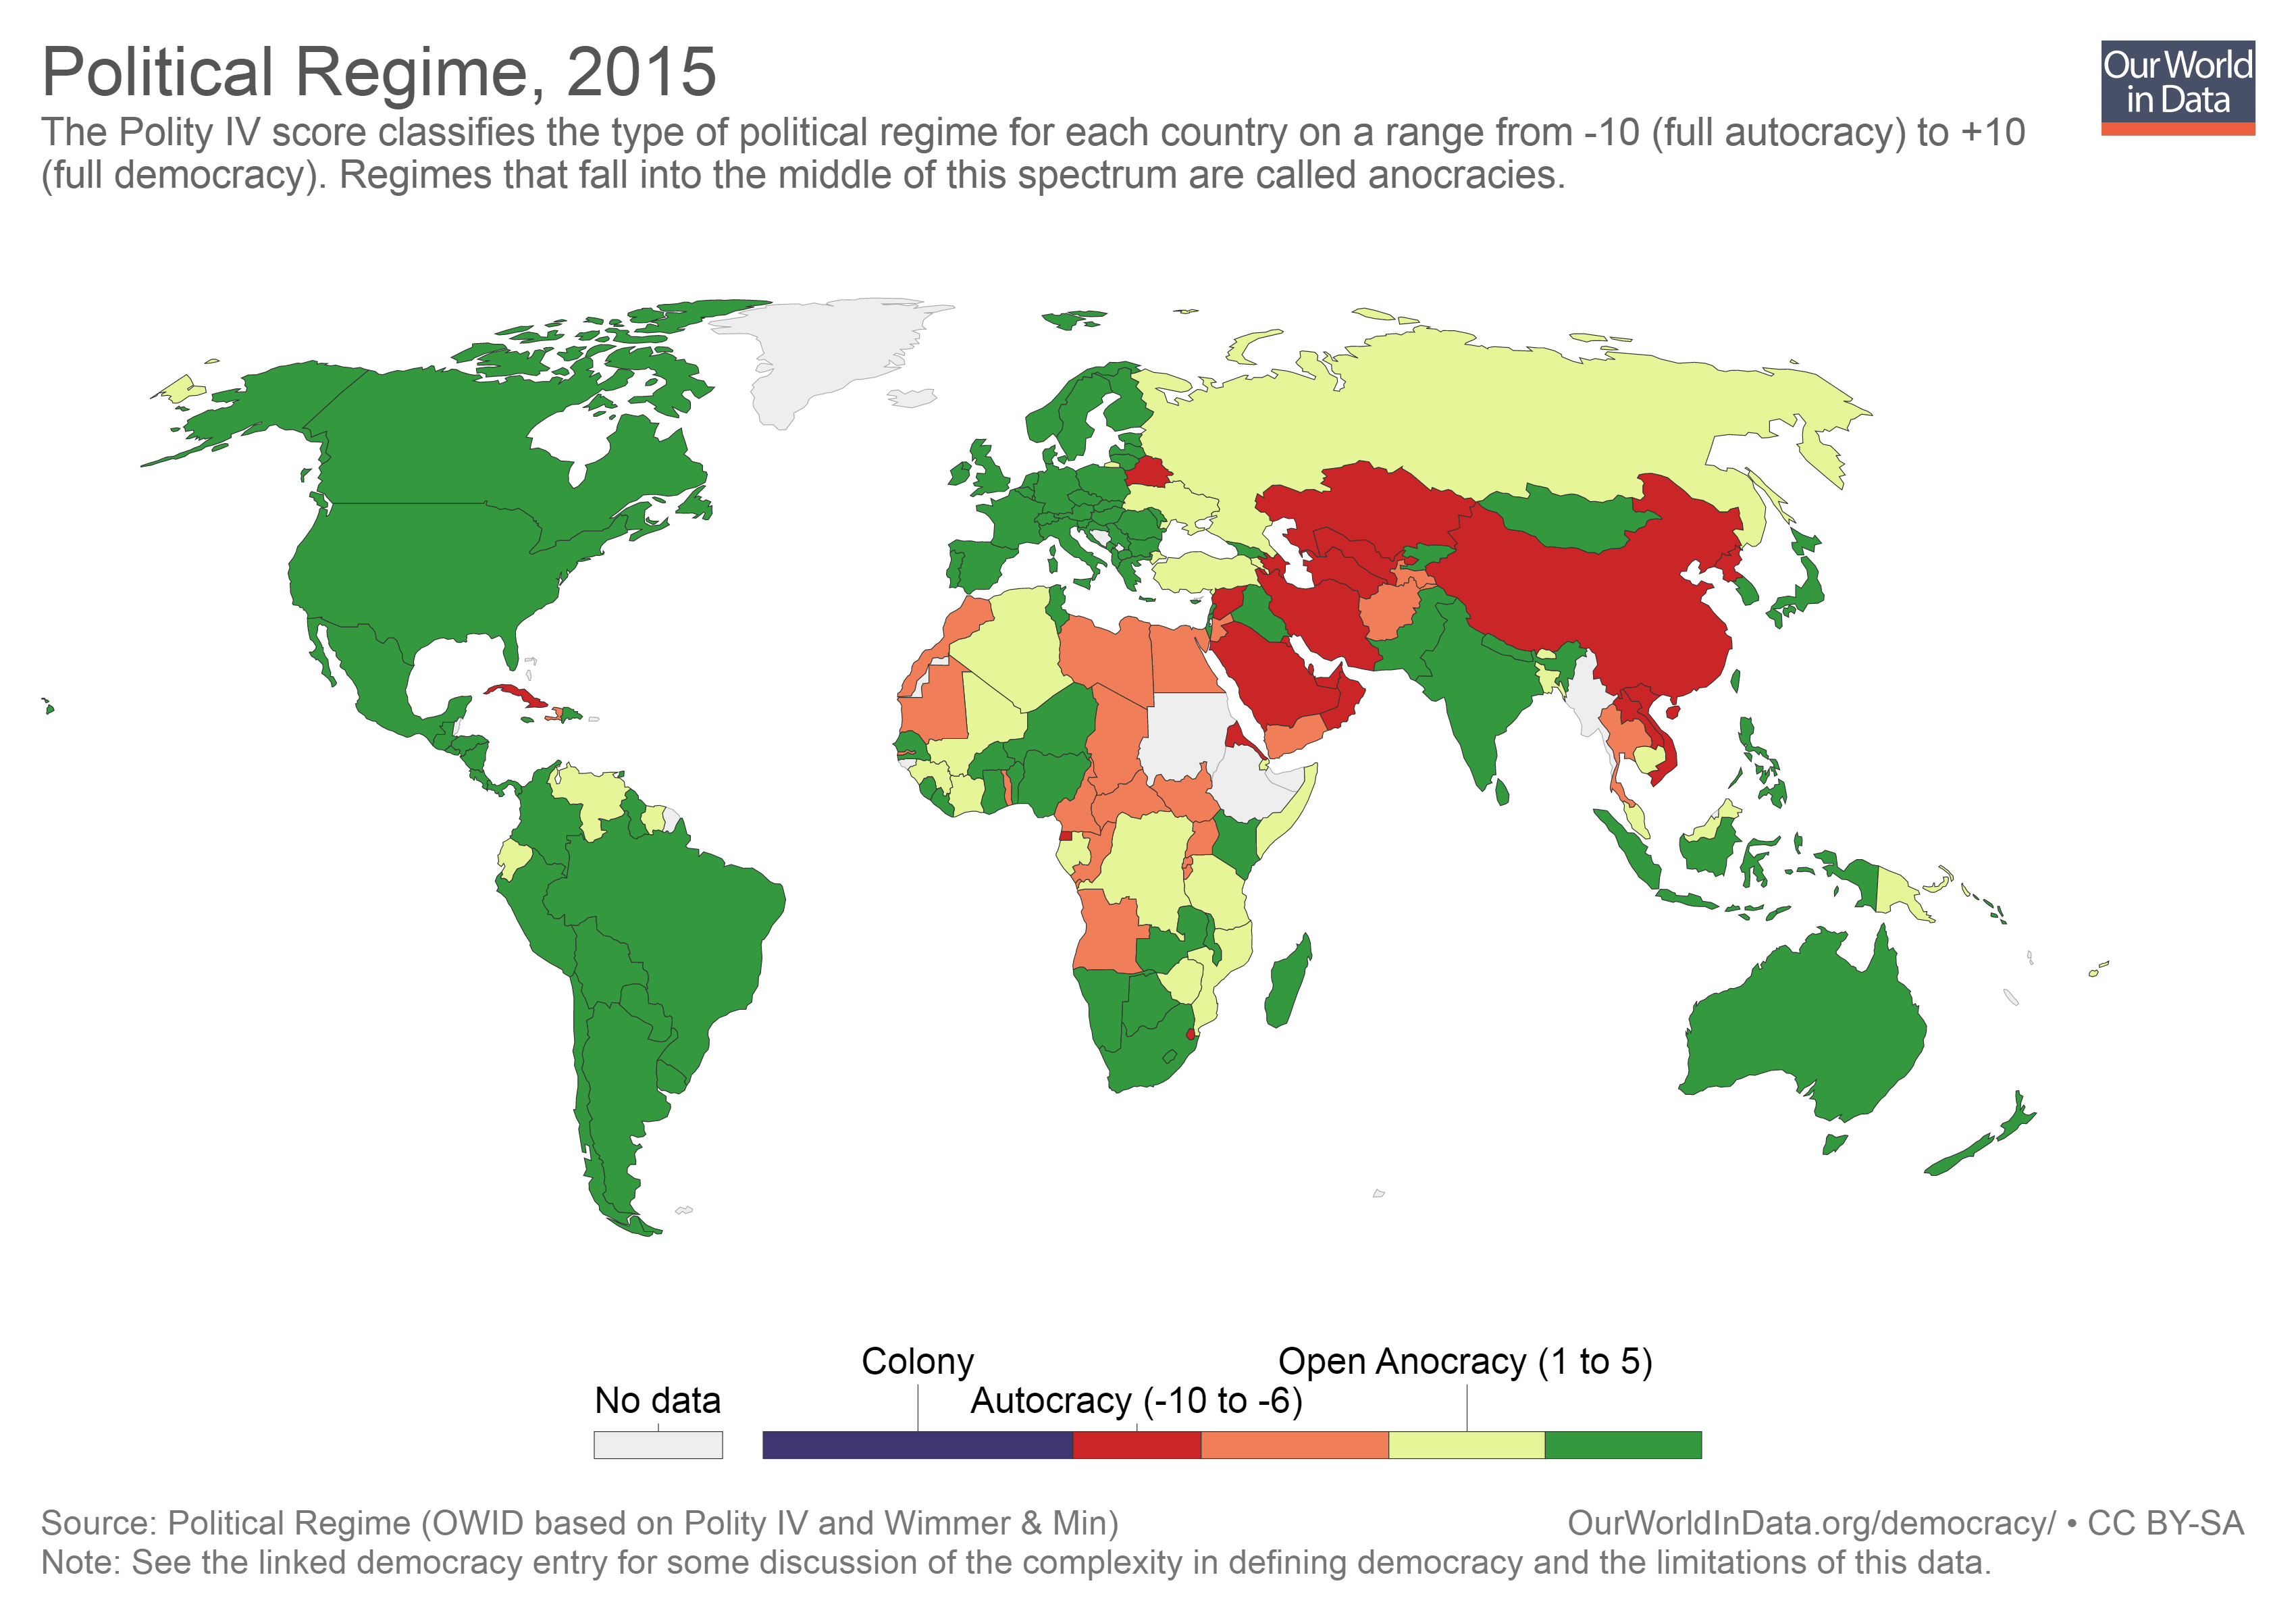
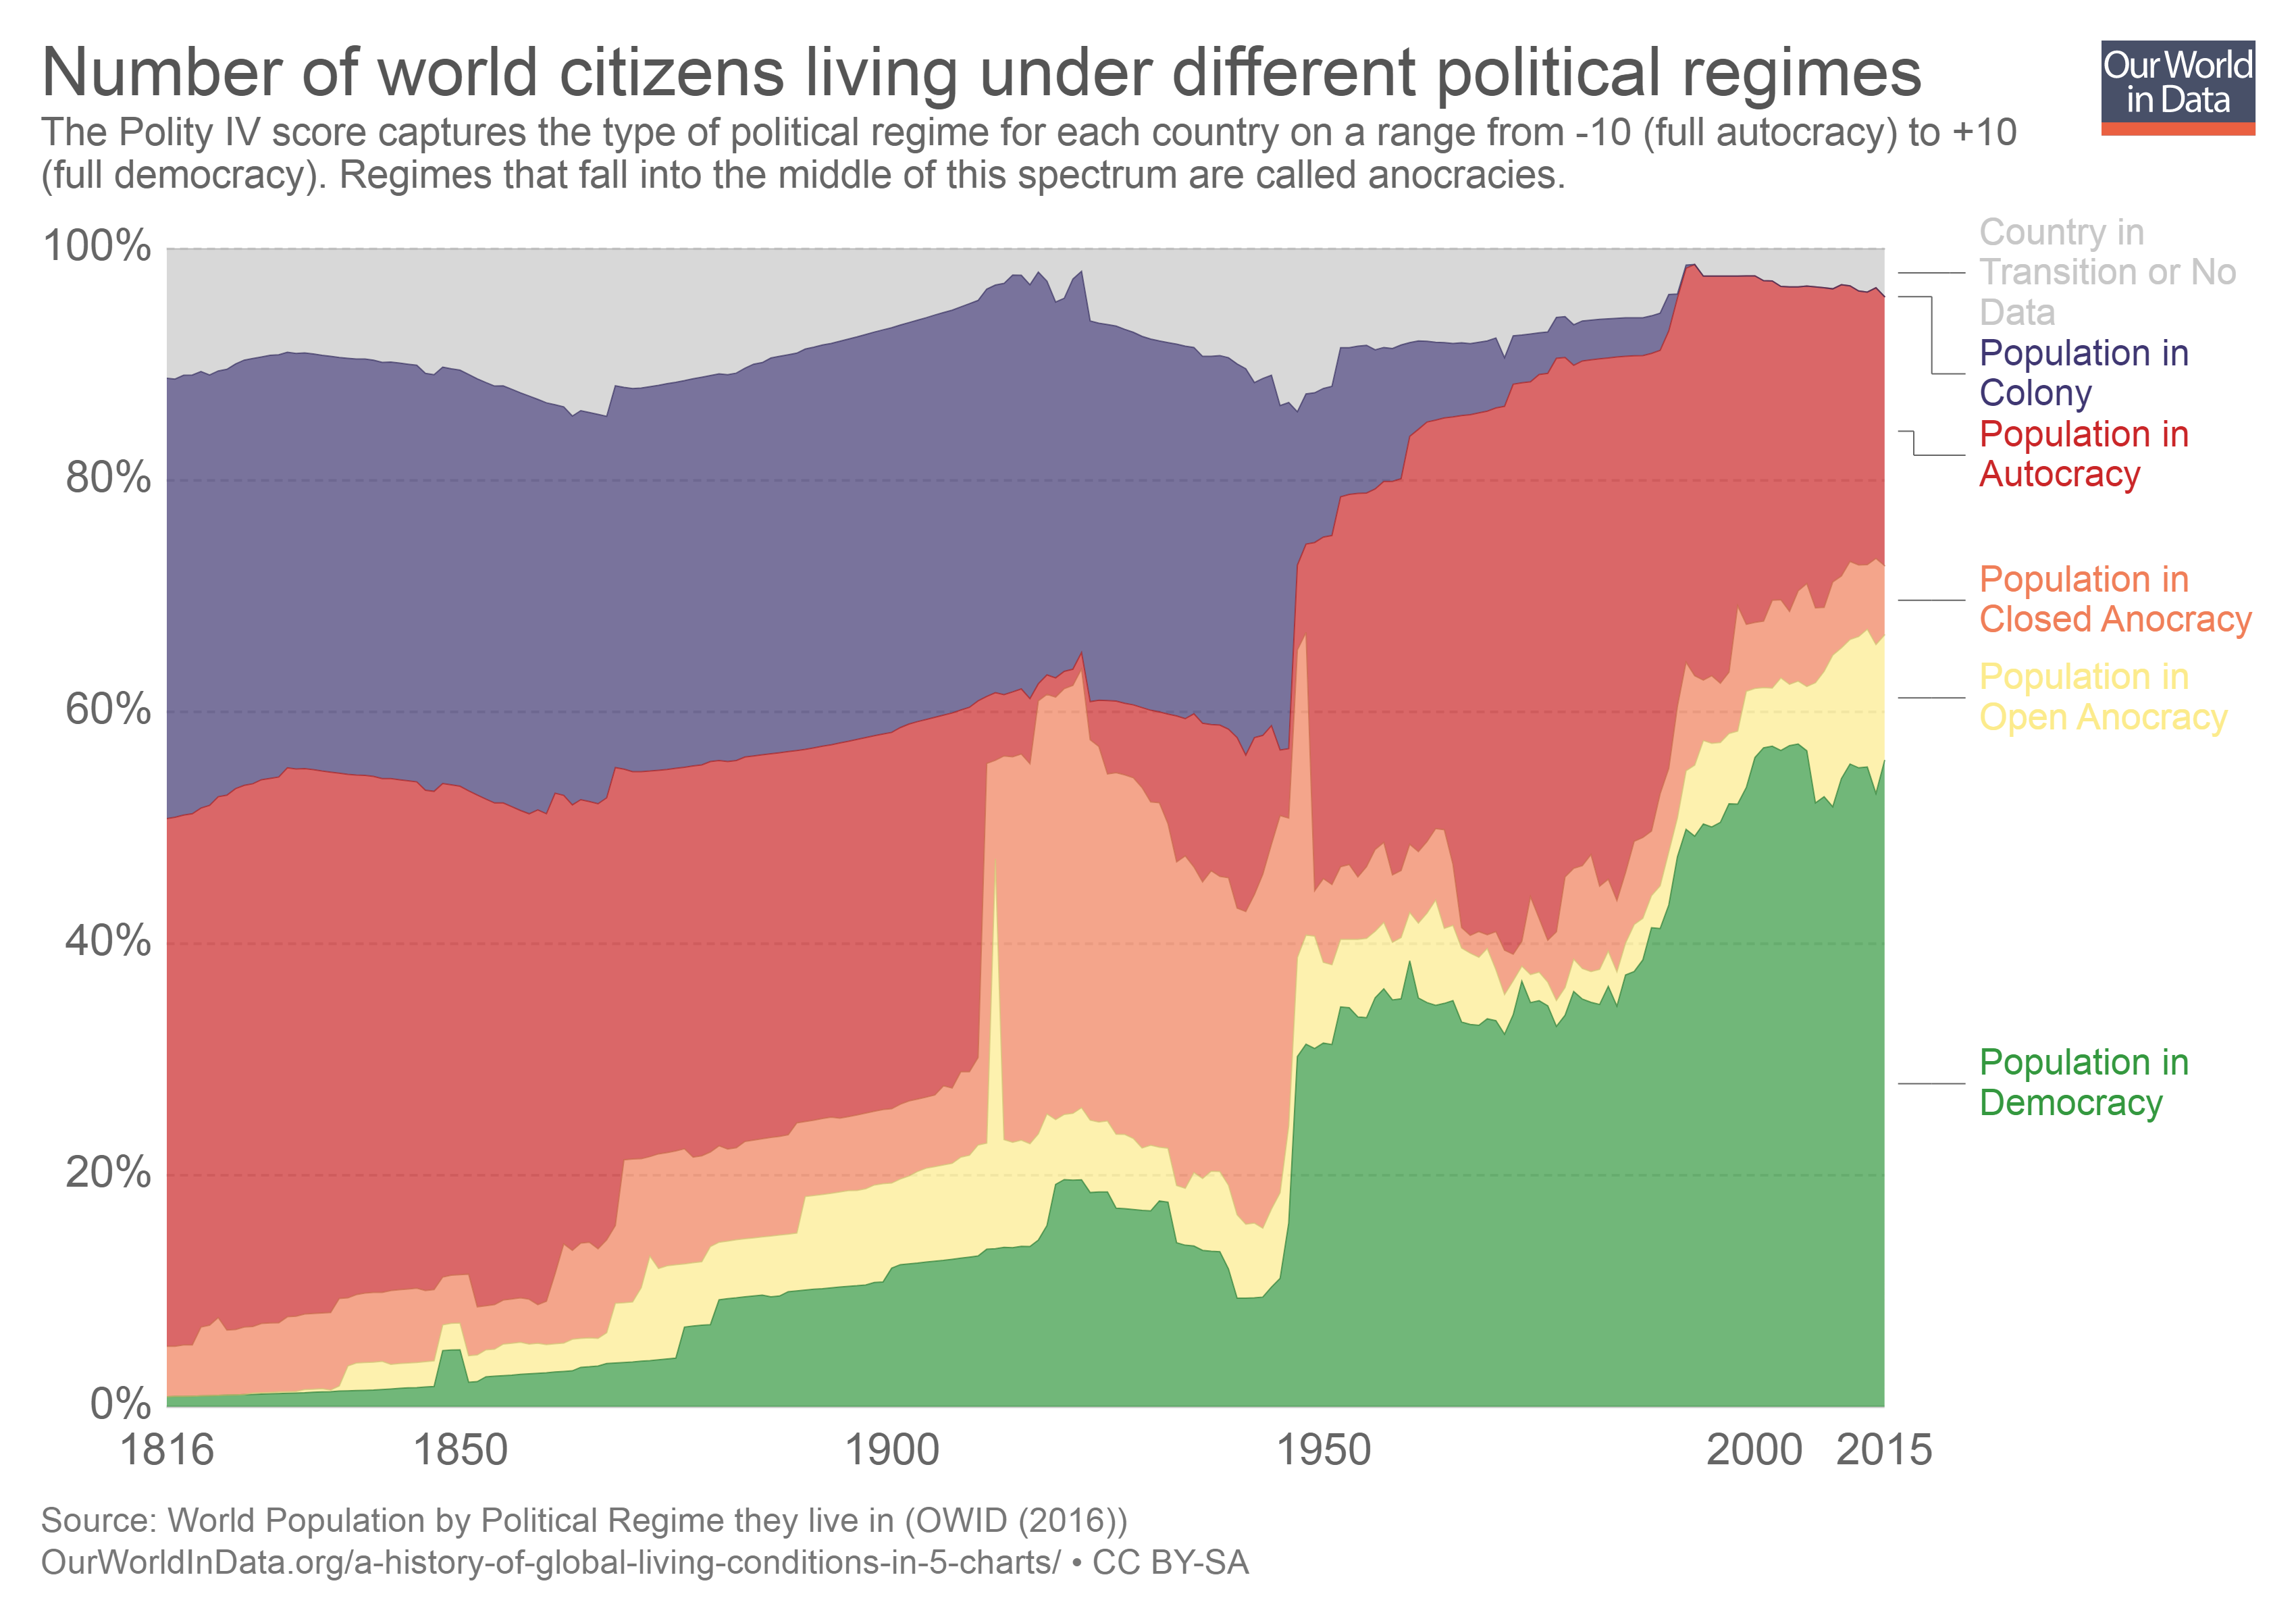
Sources: Our World in Data: Democracy; Polity IV Data
Political Development and Economic Development VII

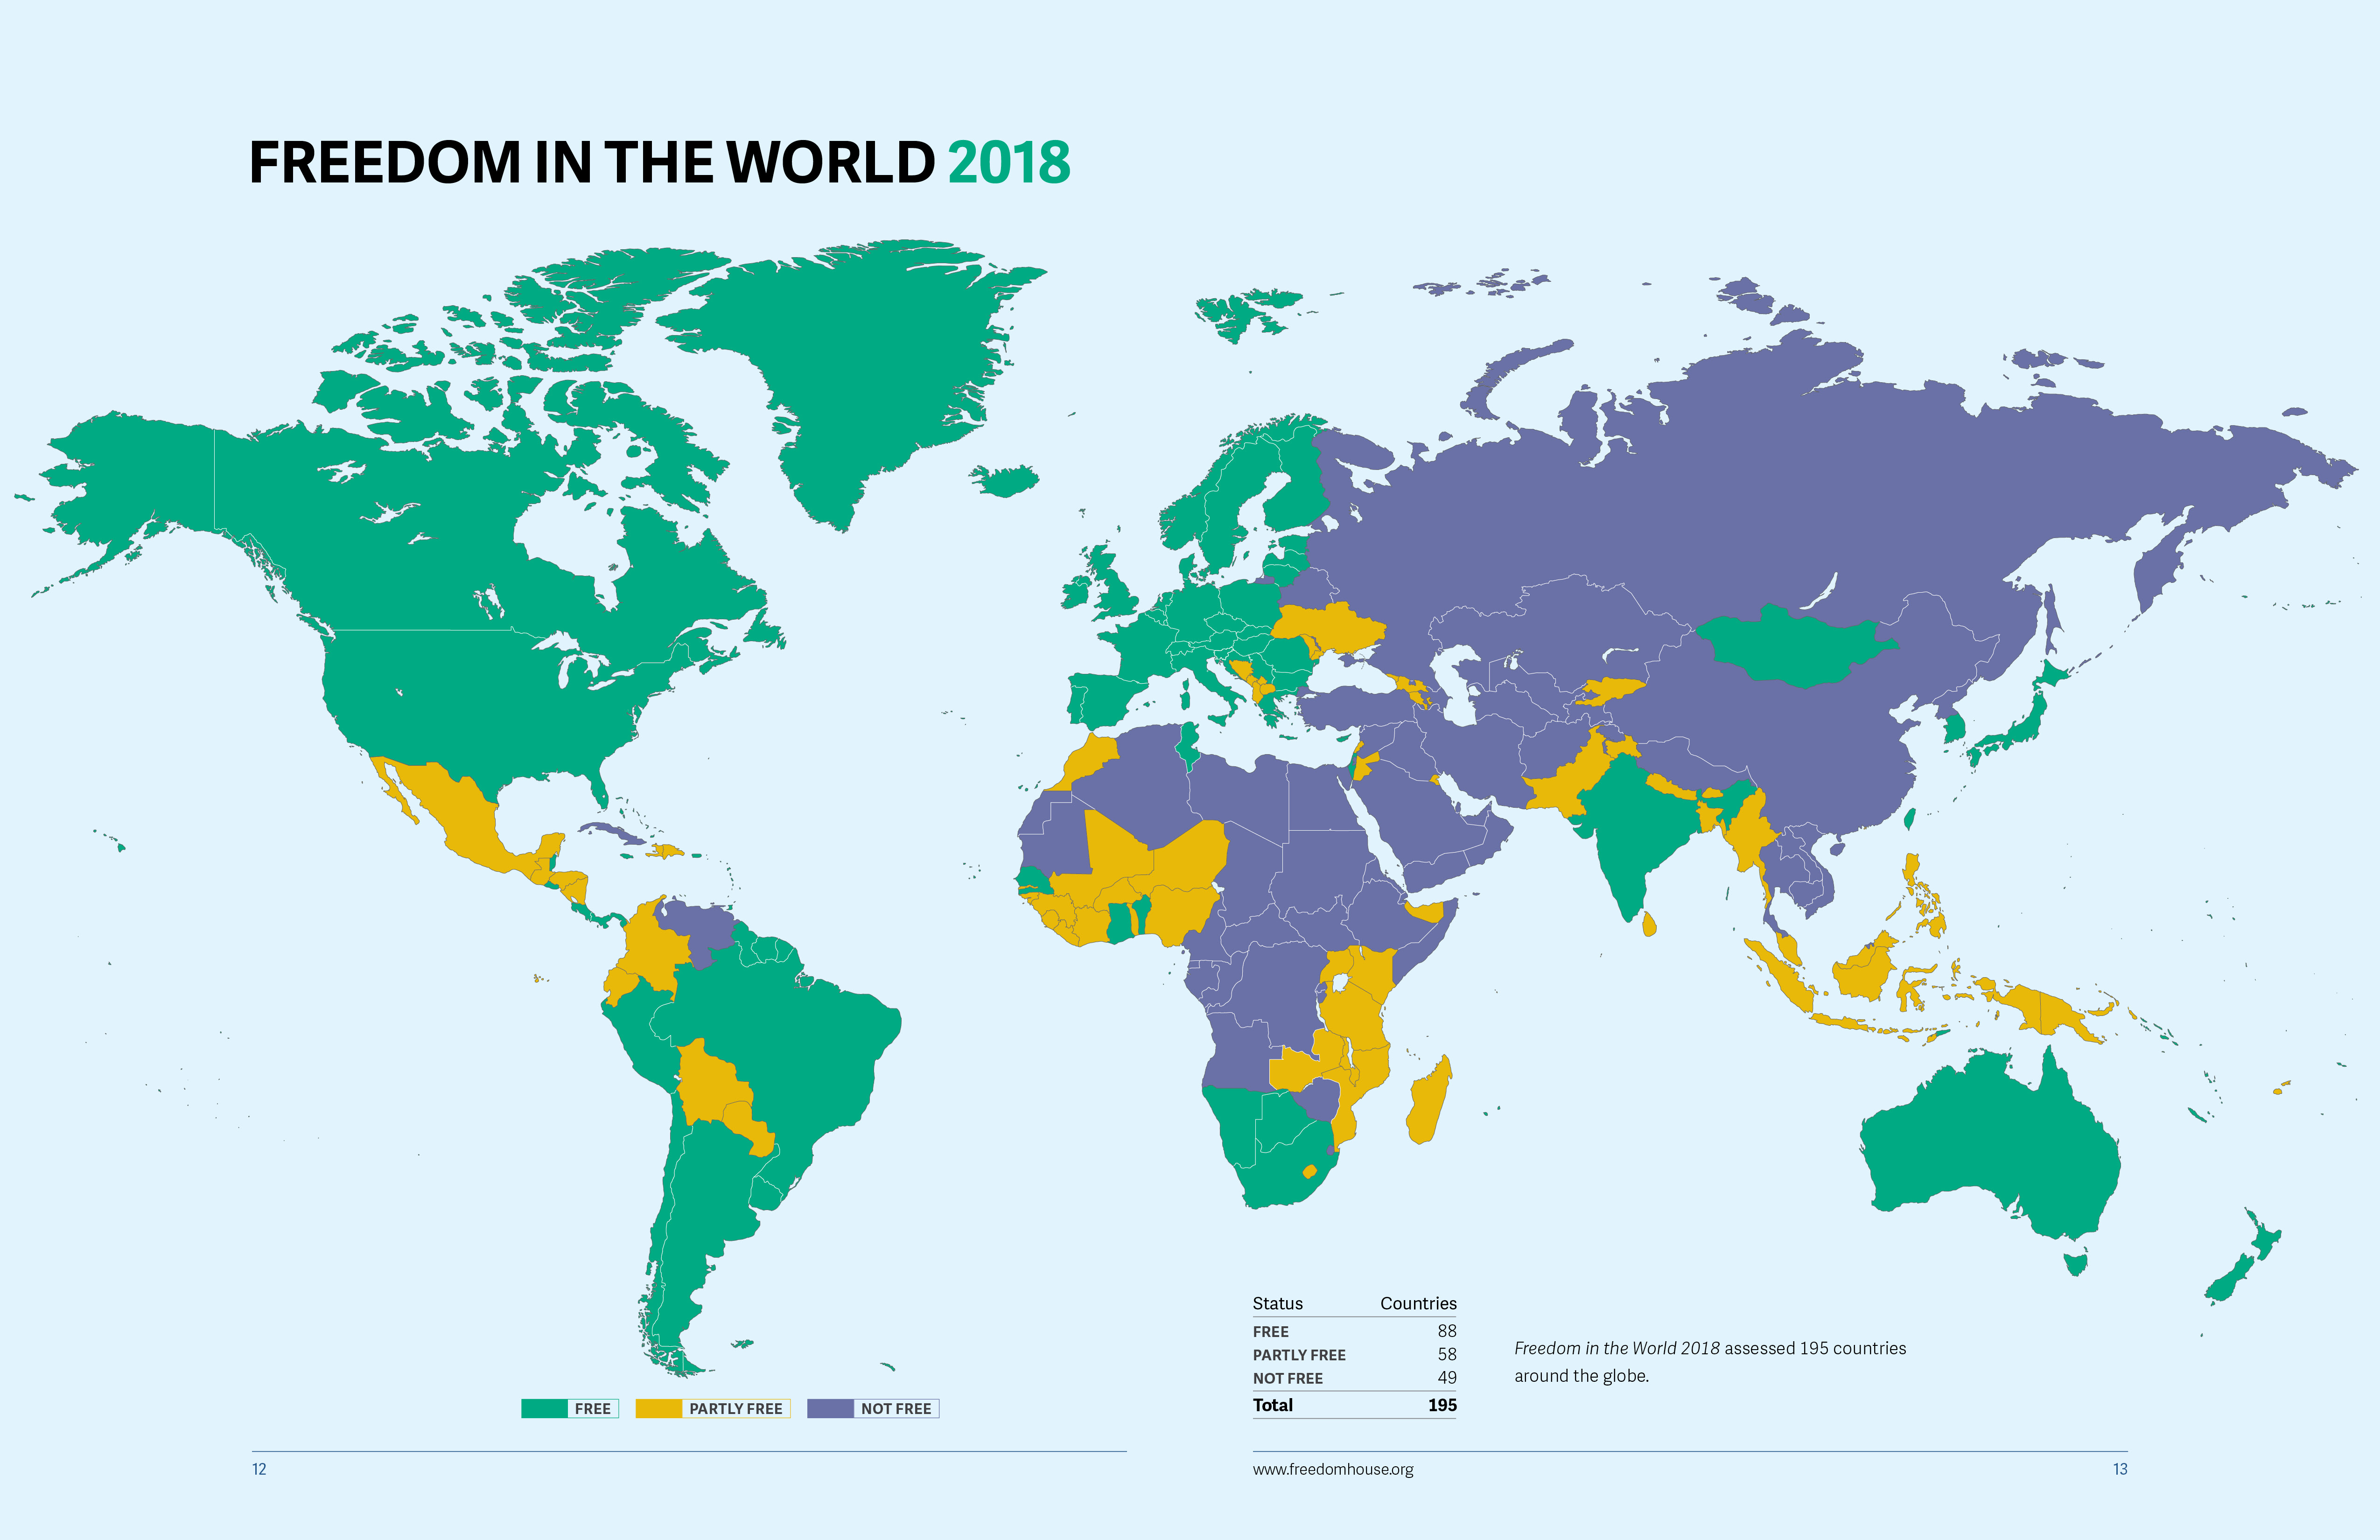
Economic Freedom Score (2016) from Fraser Institute Data; Political Freedom Score from Freedom House Data
Political Development and Economic Development VIII

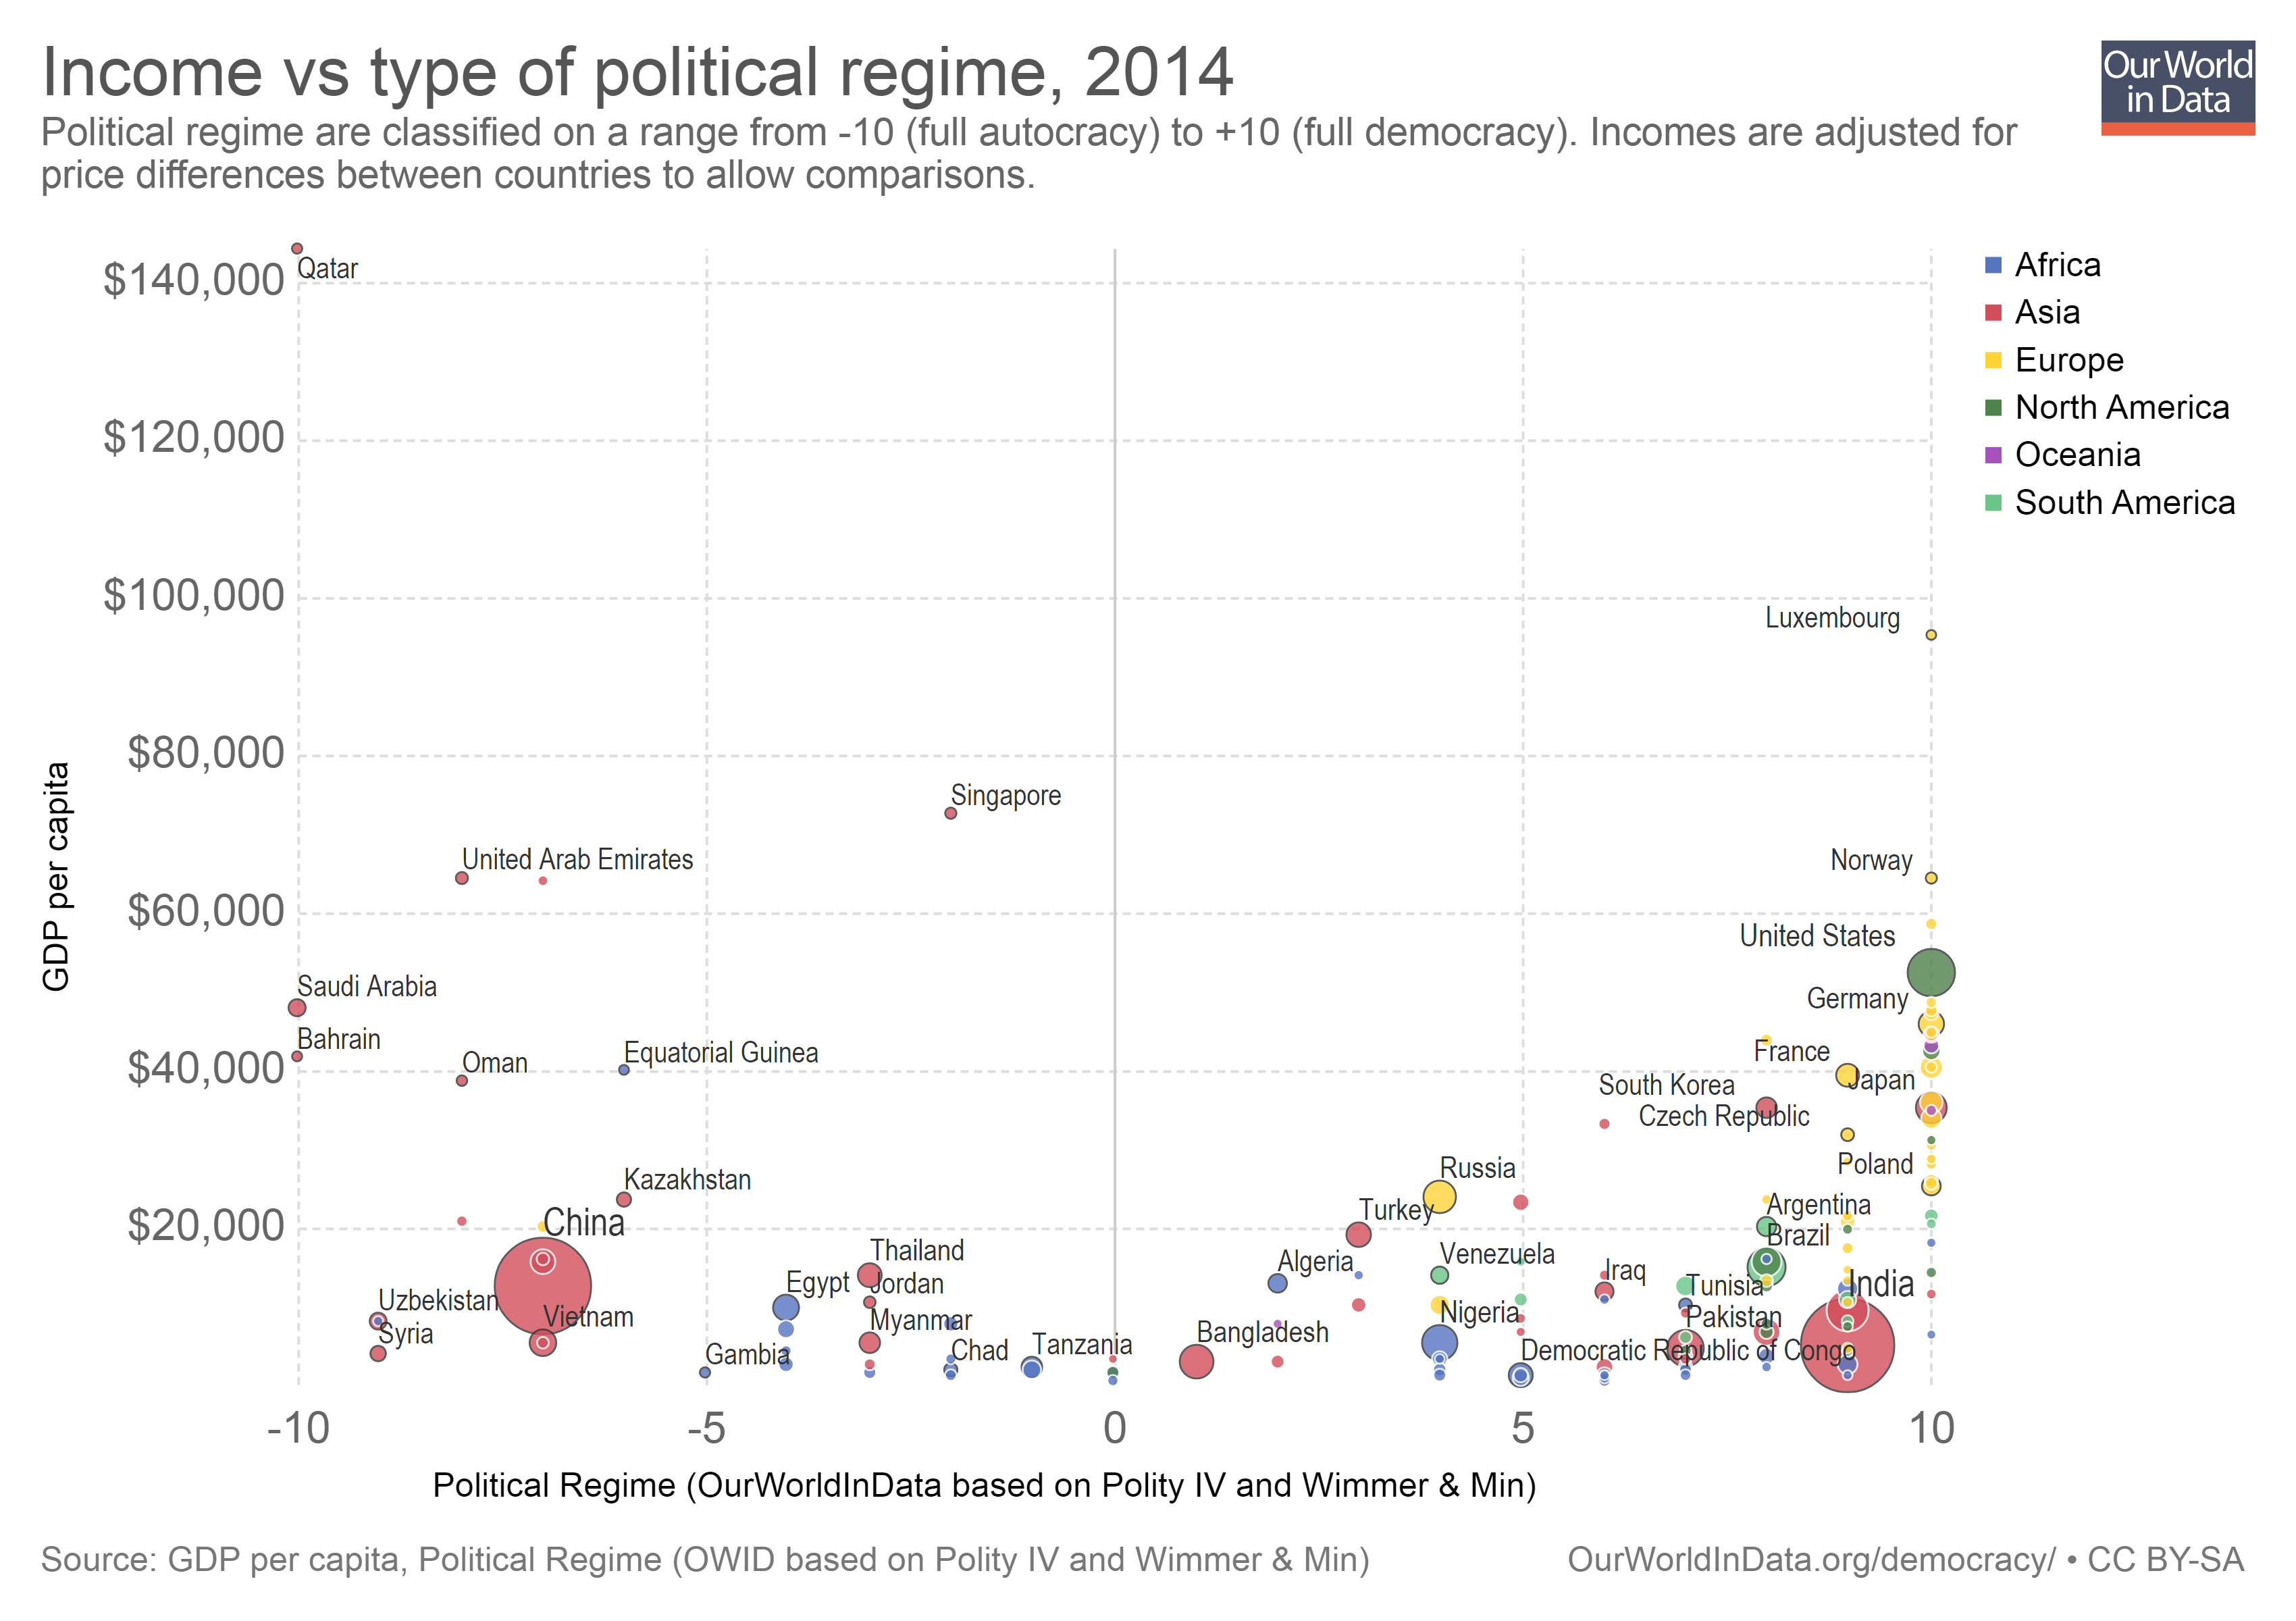
GDP per Capita (2018) from Gapminder; Political Freedom Score from Freedom House Data
Measuring Economic Development
What Do We Care About?
Among the major things, macroeconomists care about:
Economic growth (rising GDP)
A large working population (low unemployment rate)
Stable purchasing power (low inflation rate)
The three most common macroeconomic measures of an economy's performance

We Might Also Care About...
Wealth (in)equality
Health outcomes
Life quality/satisfaction
Environmental quality
Political stability
Low corruption
Human and civil rights (especially for minority groups)

GDP
Gross Domestic Product (GDP)
- Gross Domestic Product (GDP): market value of all final goods and services produced within a country in a year
- market value, measured in current prices (dollars, euros, yen, etc.)
- final goods and services
- Avoid double-counting intermediate goods
- Sales of used goods not included
- produced within a year (new things only, nothing old)
- measured within an individual country (inside the borders)
- includes foreign nationals living here
- does not include our citizens living abroad (see GNP below)
Gross Domestic Product (GDP)
- Gross Domestic Product (GDP): the market value of all final goods and services produced within a country in a year
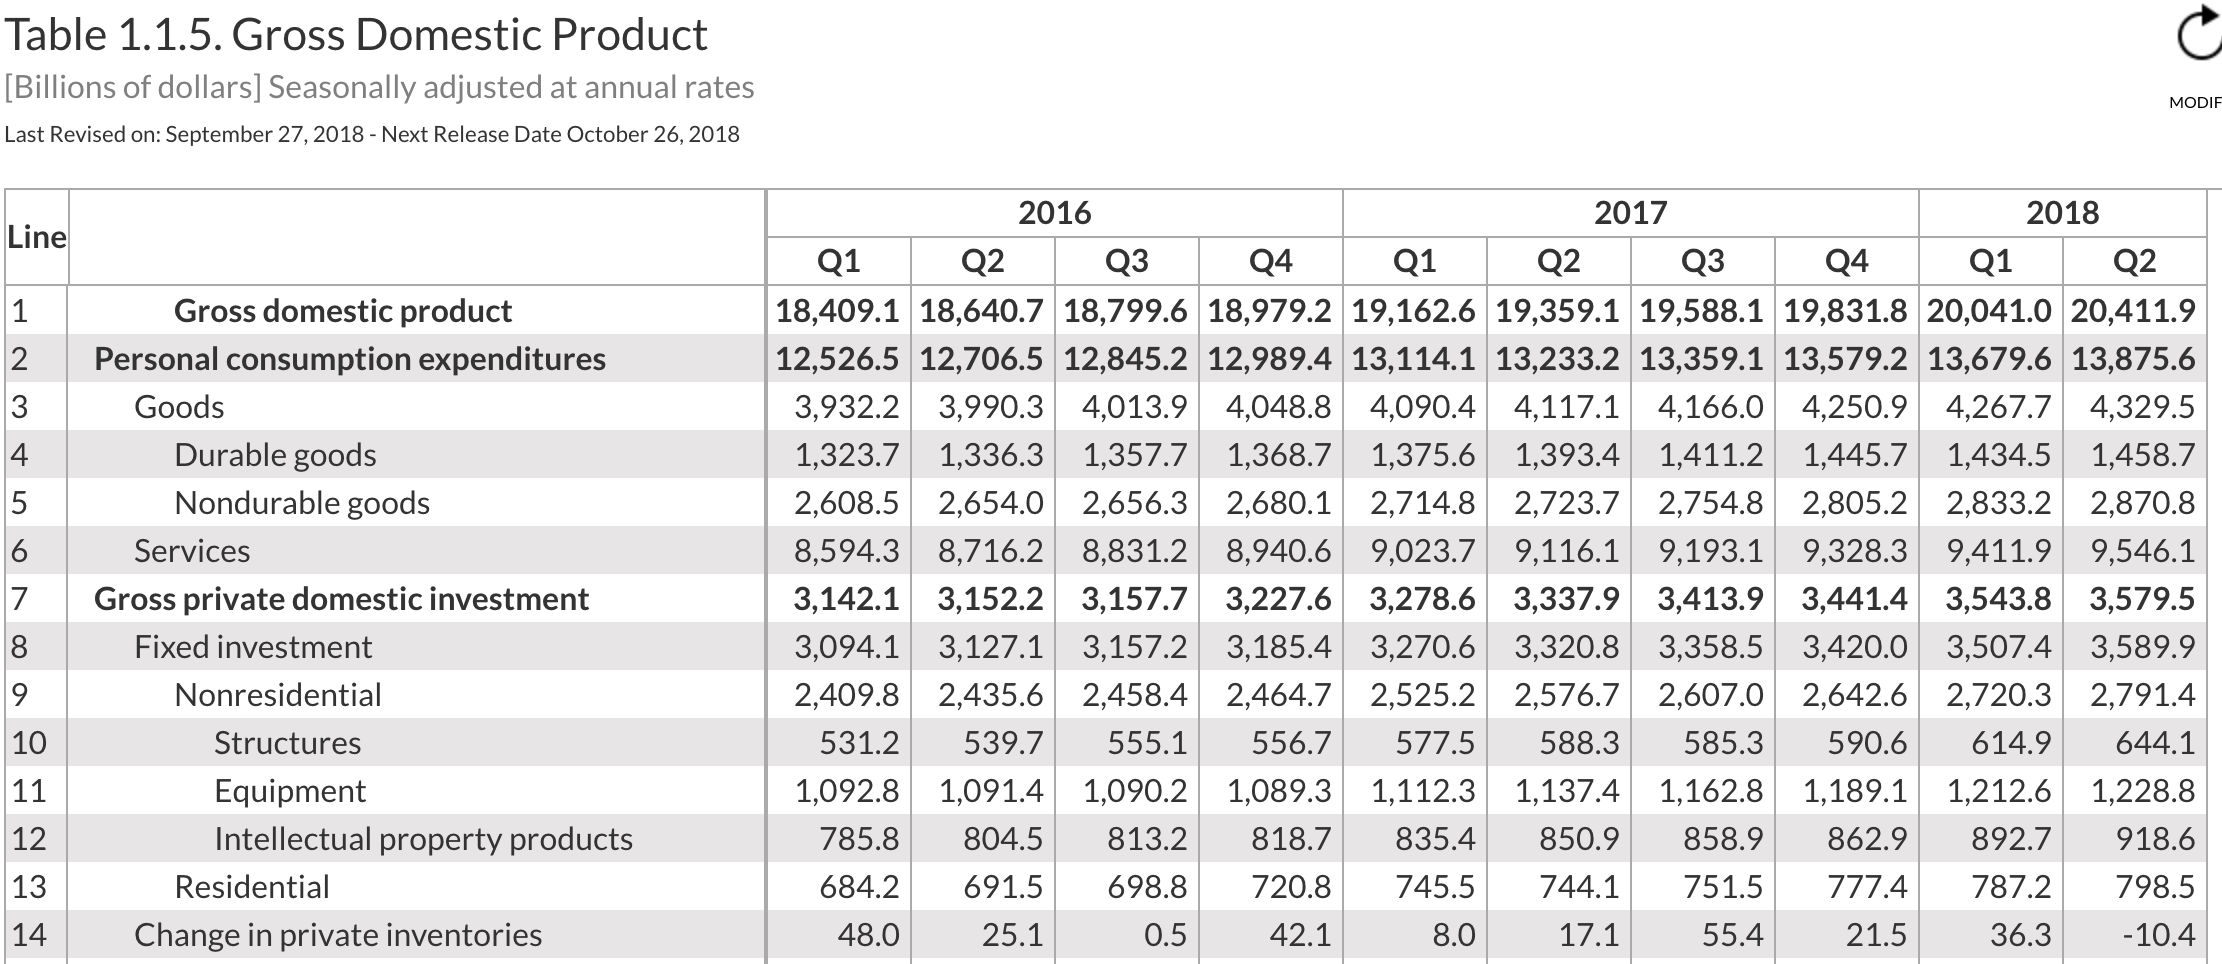
Y=C+I+G+NX
- Y: national income
- C: consumption
- I: investment
- G: government spending
- NX: net exports = exports (X)−imports (M)

Gross National Income
Gross National Income (GNI)1: market value of all final goods and services produced by resources owned by a country's citizens both at home and abroad
- i.e. take GDP and add production by Americans living abroad
Comparing GDP to GNP shows how much a nation's citizens' wealth comes from domestic vs. international sources
1 This used to be called Gross National Product (GNP).
GDP per Capita
- GDP/GNI is a rough measure
- If a tiny country and a large country have the same GDP, who is better off?
- Want to weight GDP by the size of a country
GDP per capita is a measure of income per person1: GDP per capita=Gross Domestic ProductPopulation
A better measure of how the "average" person is doing in a country

1 Capita means person.
GDP per Capita II
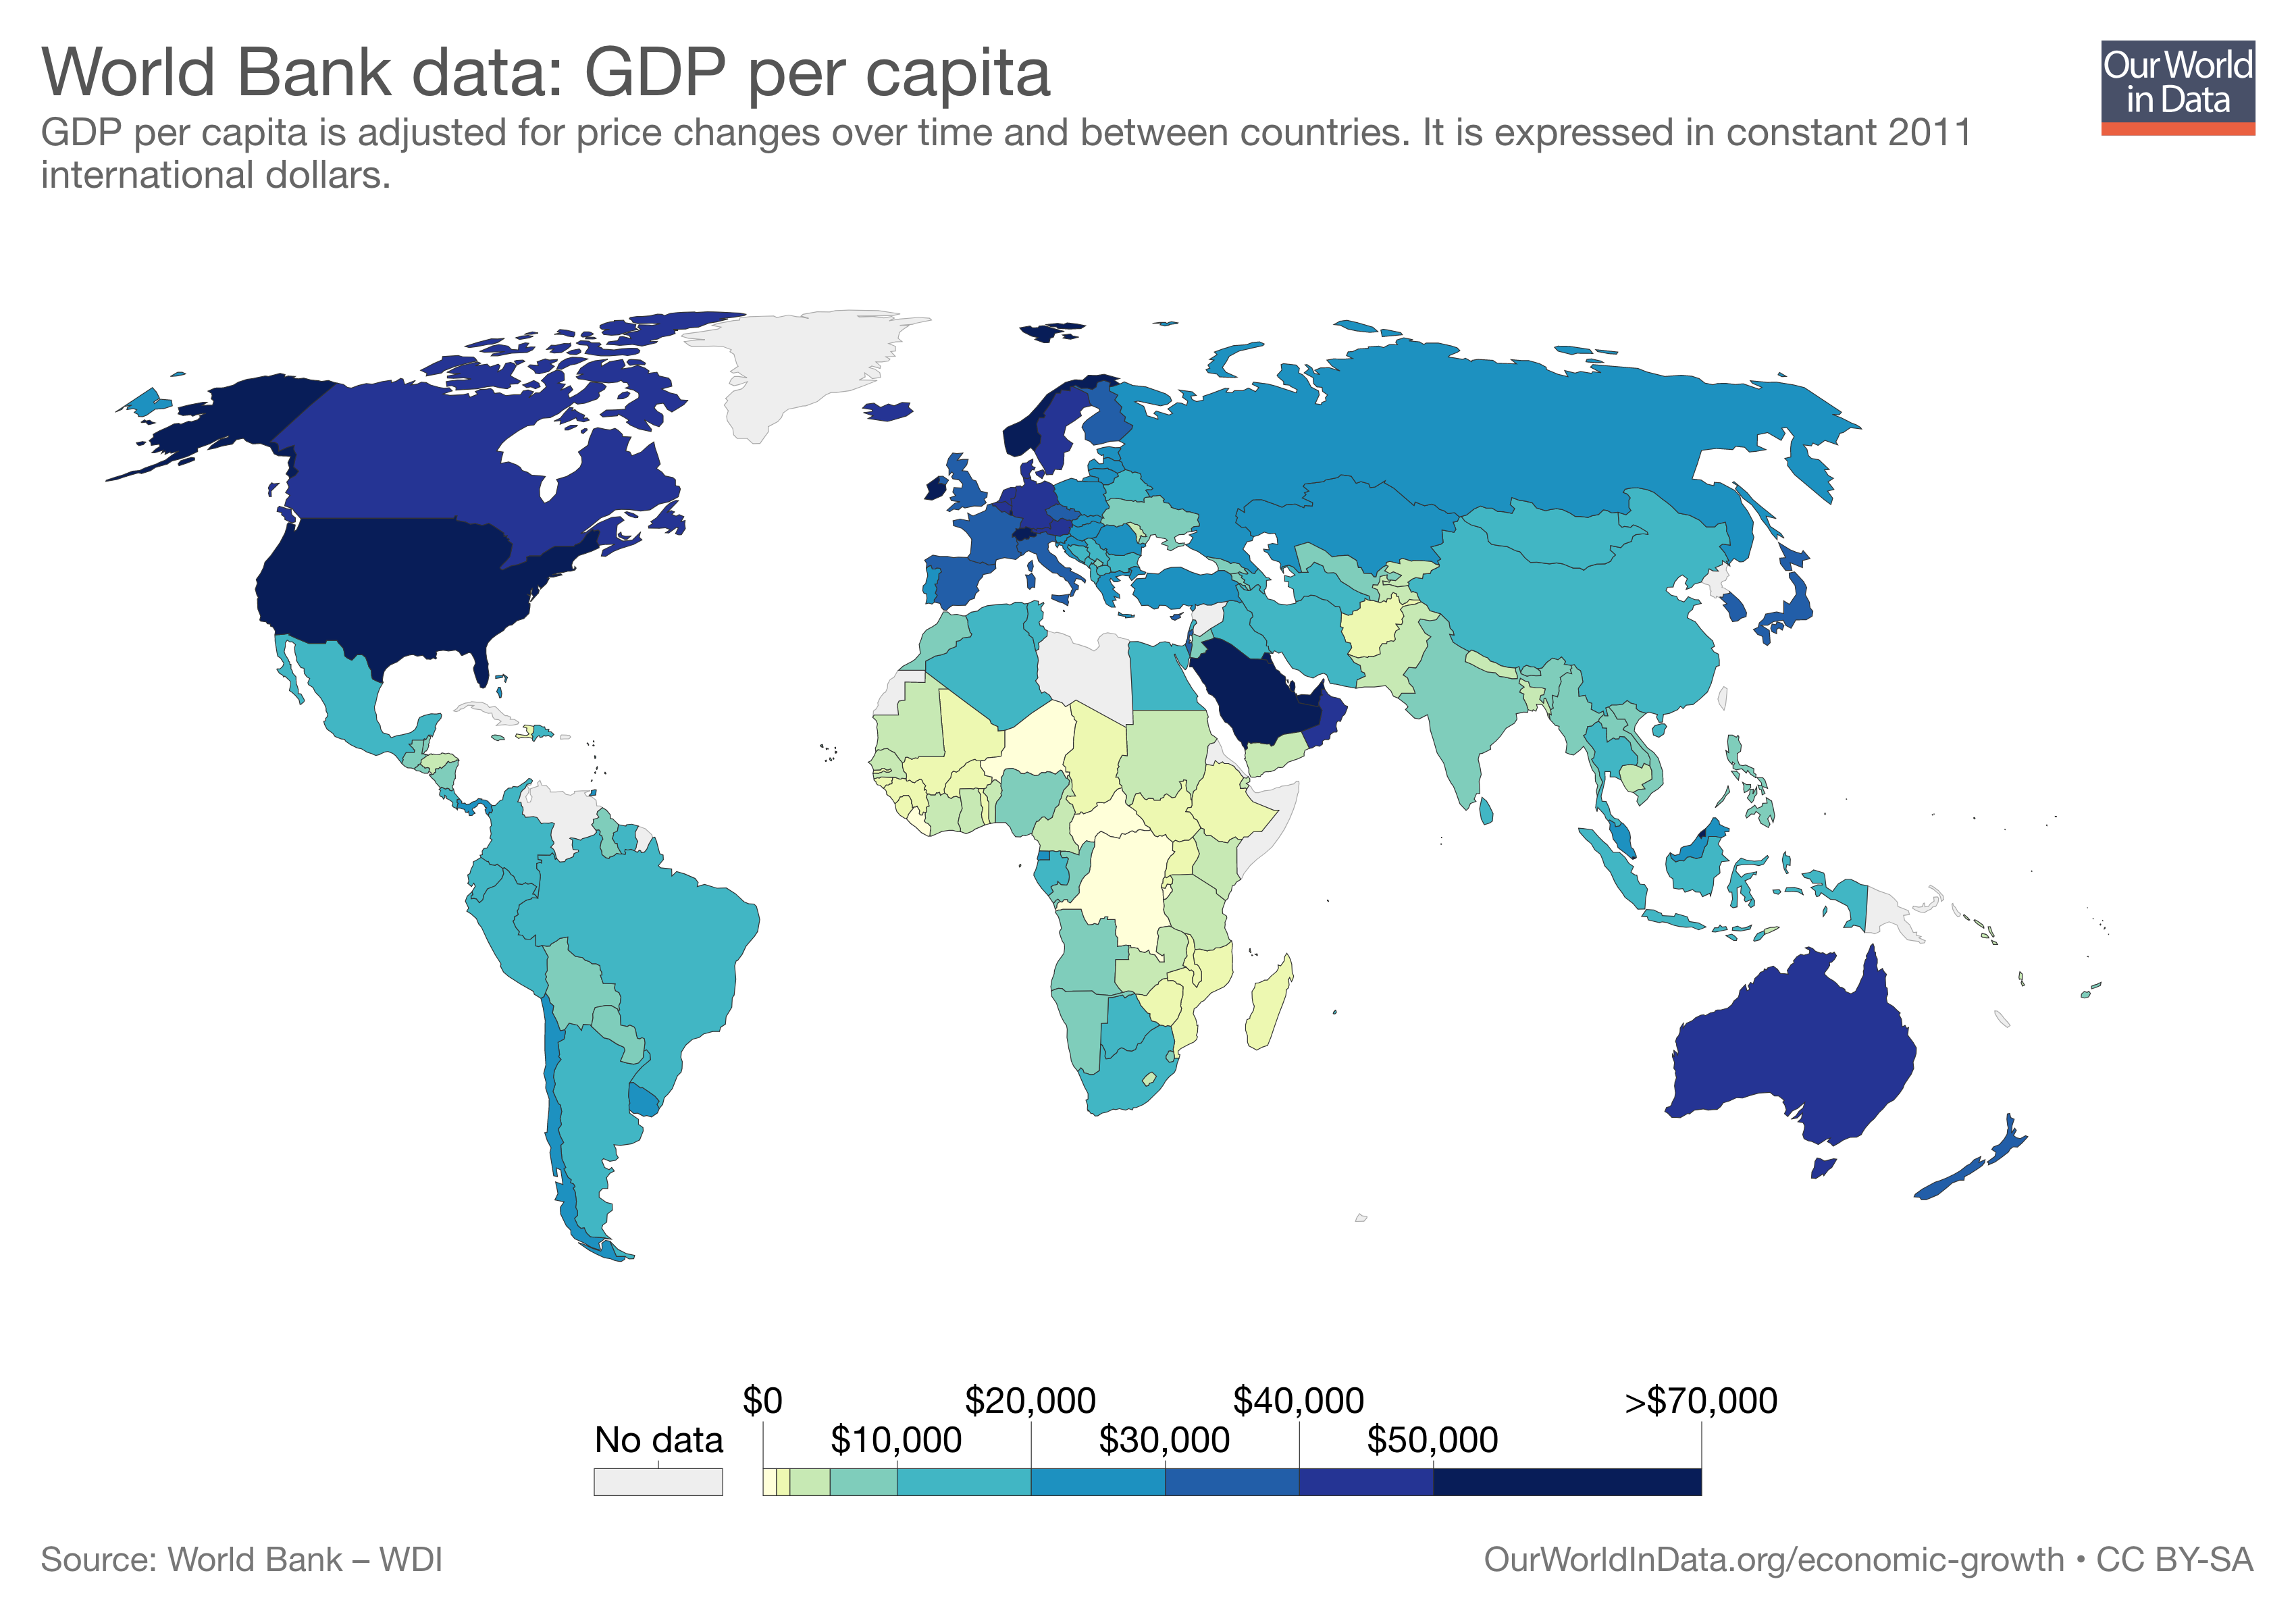
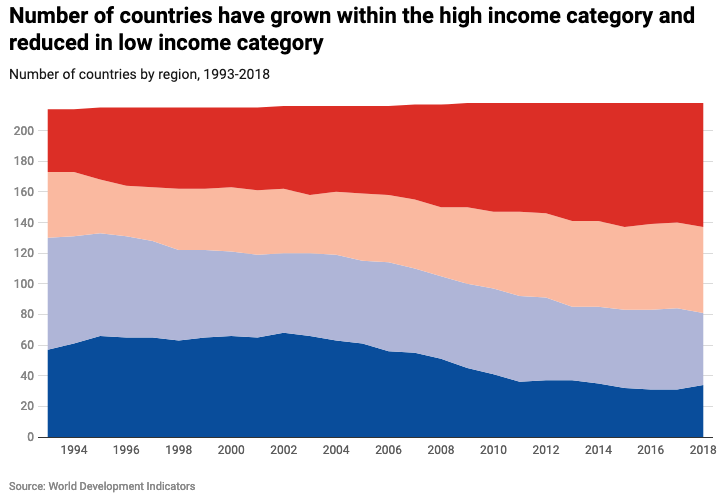
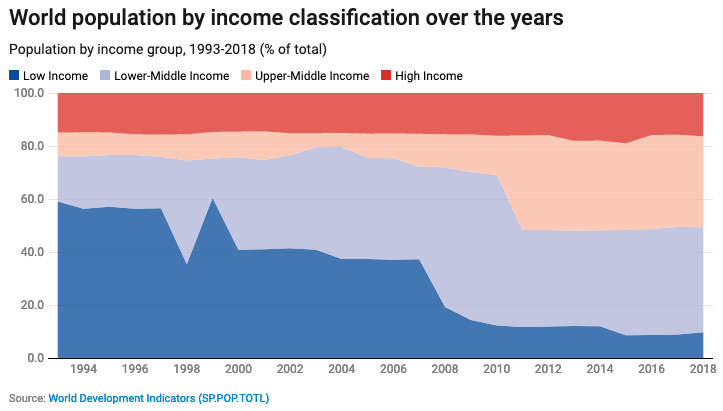
Country "Income Levels"
The World Bank defines as of 1 July 2018 countries as being:
| Income level | GNI per capita |
|---|---|
| High income | >12,055 |
| Upper-middle income | 3,896−12,055 |
| Middle income | 996−3,895 |
| Low income | ≤995 |
Comparing Across Countries I
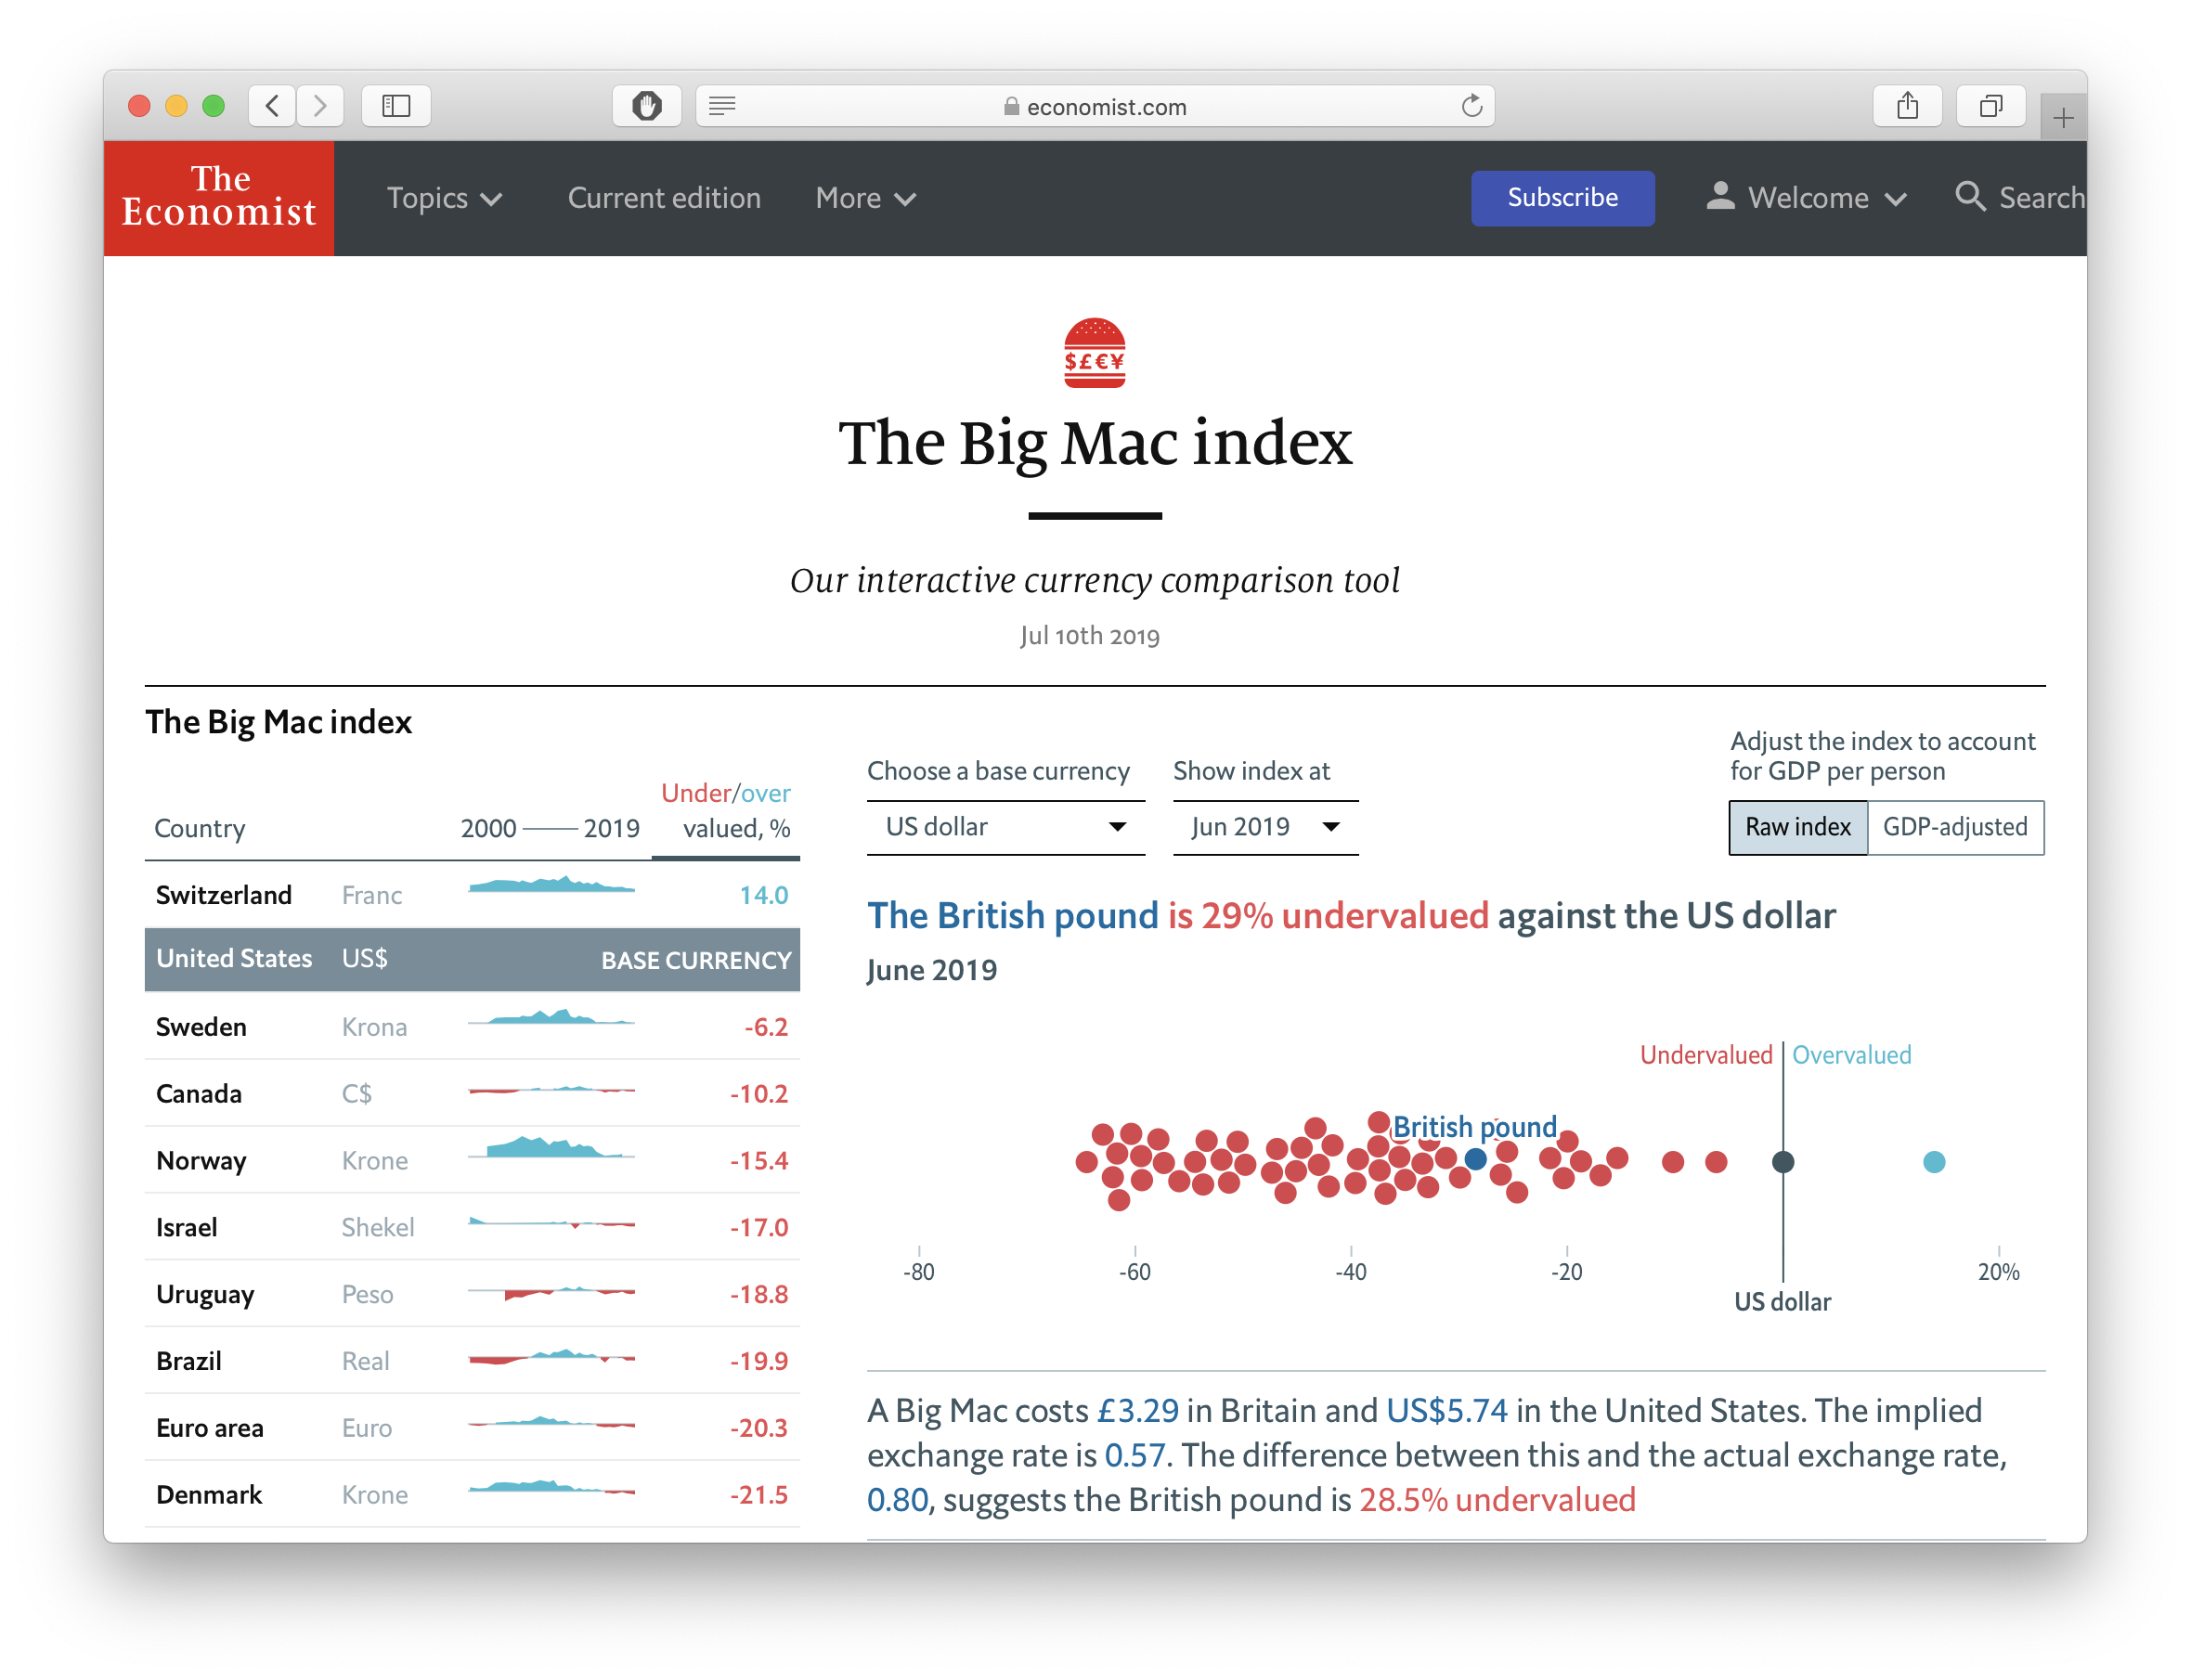
To compare GDP across countries that use different currencies (e.g. Pounds, Euros, Yen, Yuan), we need a common denominator by using an exchange rate between currencies
Exchange Rates express the amount of one currency needed to convert to 1 unit of another
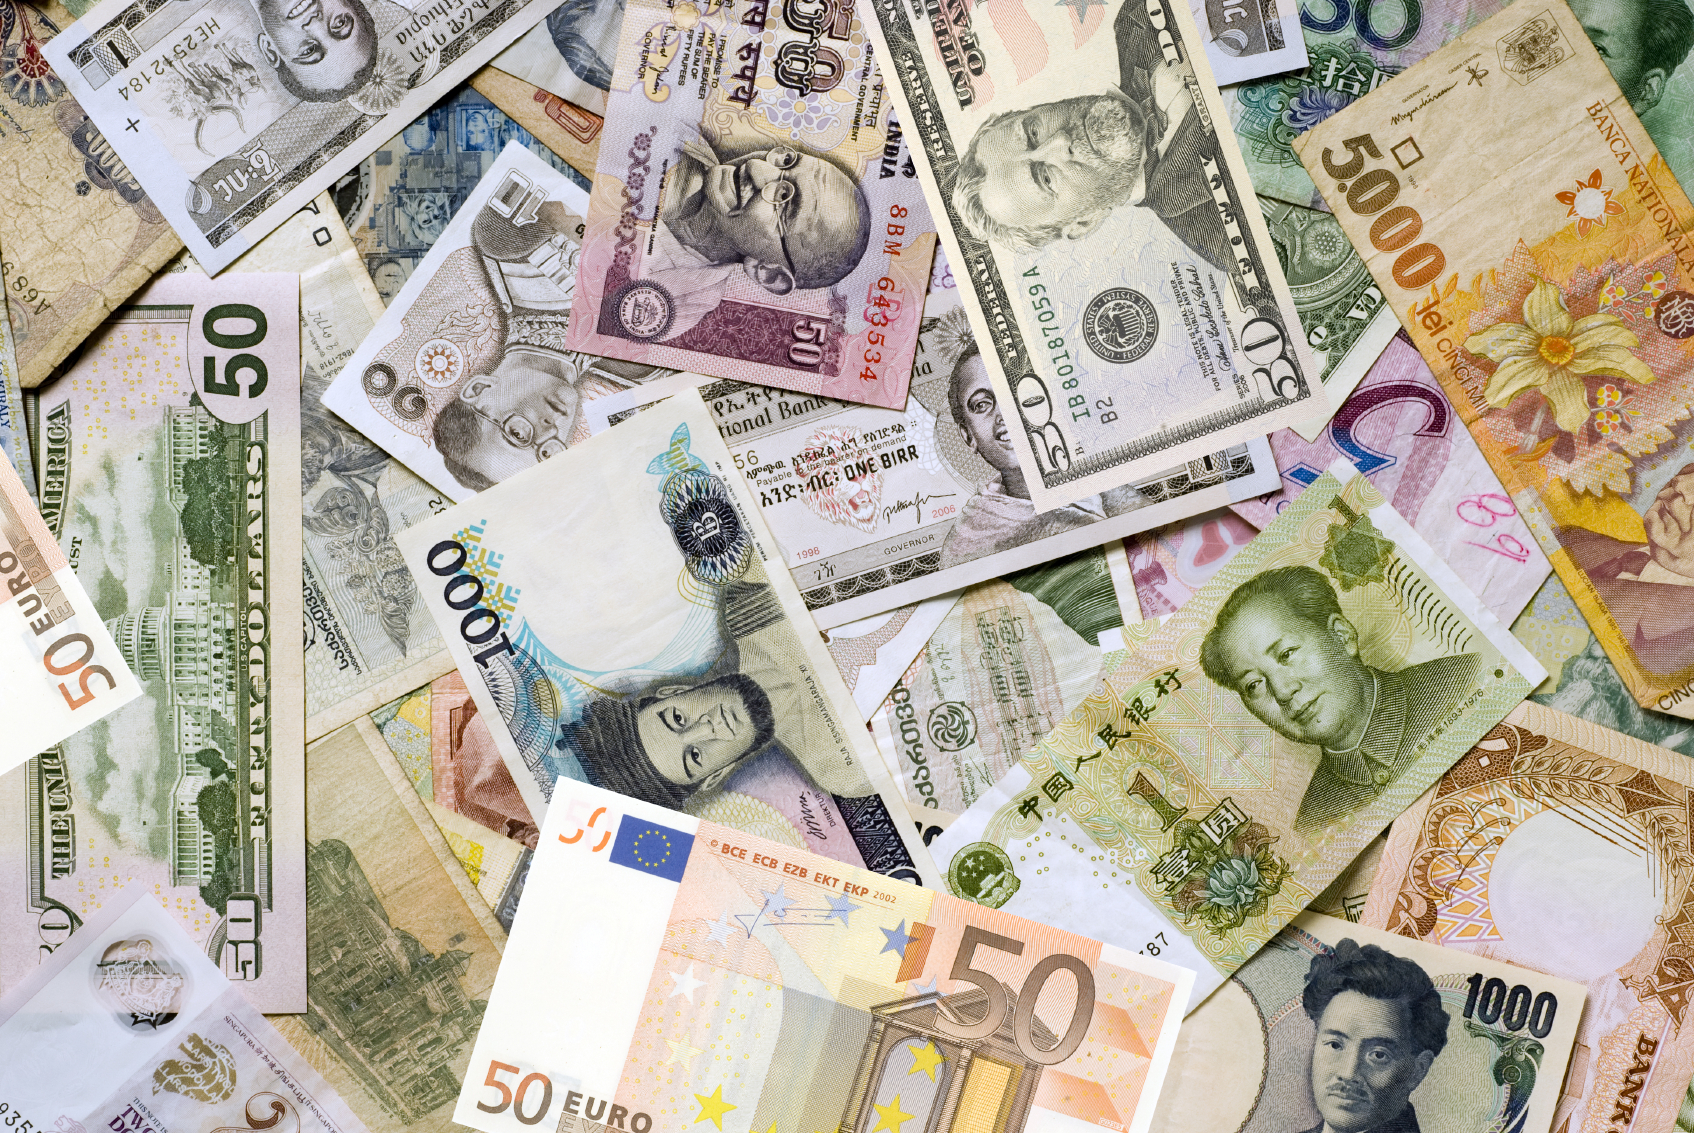
Comparing Across Countries I
To compare GDP across countries that use different currencies (e.g. Pounds, Euros, Yen, Yuan), we need a common denominator by using an exchange rate between currencies
Exchange Rates express the amount of one currency needed to convert to 1 unit of another
Example: 0.88 EUR:1 USD0.78 GBP:1 USD1.30 CAD:1 USD

Comparing Across Countries II
- To calculate another country's GDP in US Dollars:
Other Country's GDP in USD=Other Country's GDP in Local CurrencyExchange Rate for 1 USD
Comparing Across Countries: Example
Example: Great Britain's GDP in 2018 is £2.307 trillion GBP. One USD ($) exchanges for 0.88 pounds sterling (£). Calculate British GDP in US Dollars.
Britain's GDP in USD=£2.307 trillion£0.88/$1 =$2.622 trillion
Purchasing Power Parity (PPP) I
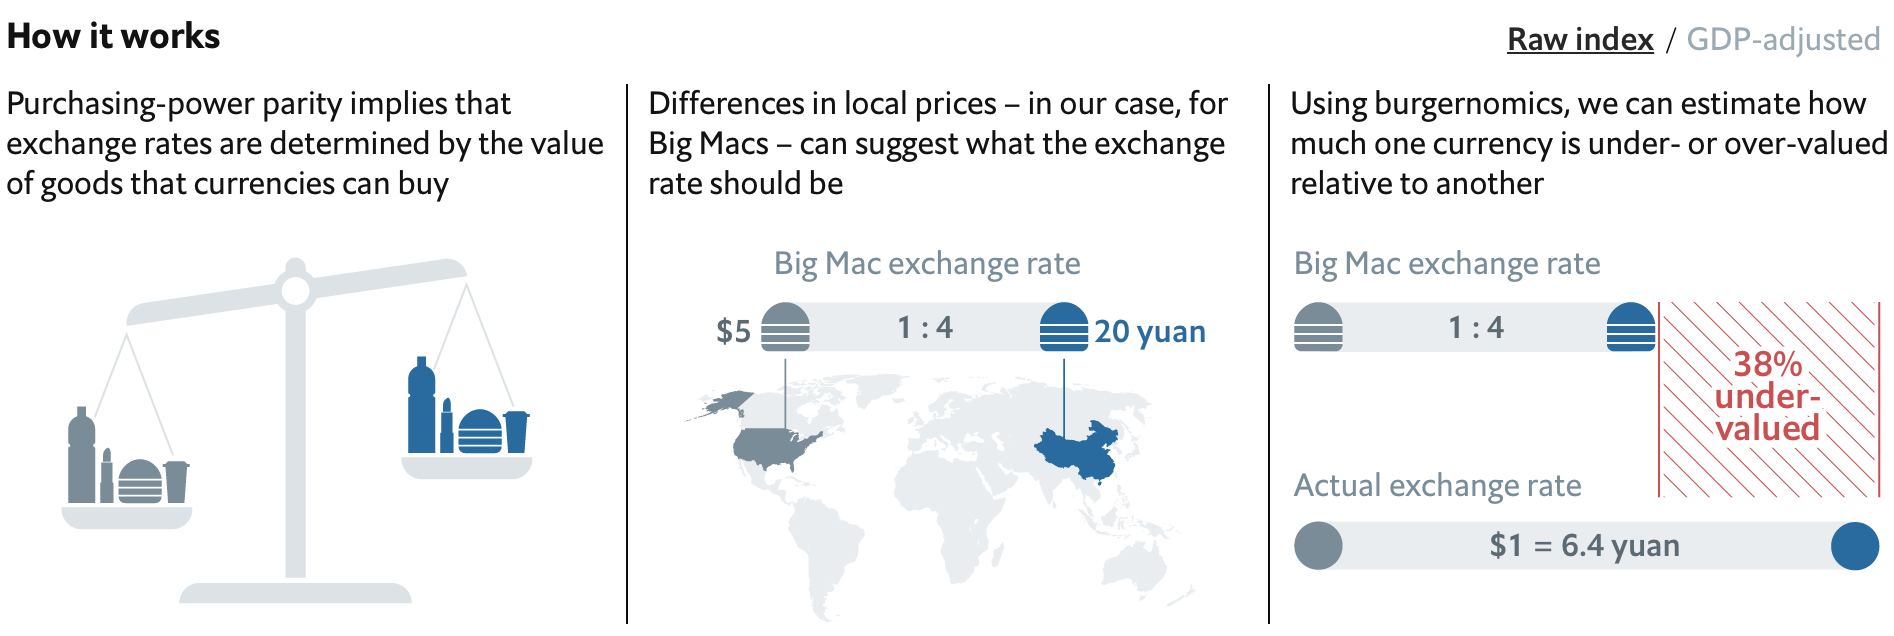
- Economists hypothesize that once converted to a common currency, prices should be roughly identical across countries, i.e. there should be purchasing power parity
e.g. whether you buy using Dollars in US or Euros in EU, you should get the same amount of goods on average

Purchasing Power Parity (PPP) II
- PPP is essentially an argument about arbitrage and the law of one price
Example: Suppose a sweater in the U.S. costs 50 USD.
Suppose the exchange rate is 100 YEN: 1 USD
Then the price of the same sweater in Japan should be 5000 YEN
Otherwise, an arbitrage opportunity!

Purchasing Power Parity (PPP) II
Ah, but transaction costs!
- Transportation costs
- Non-tradeable or transportable goods
- Services?
- Differences in institutions, culture, property rights
- Baumol's "cost disease"
Example: A haircut of similar quality in Norway is $65, $5 in Mexico, and $1 in India
Purchasing Power Parity (PPP) IV
Economists often use the Geary-Khamis dollar, aka the "international dollar" as the standard hypothetical unit
- The purchasing power of a US Dollar at a specified year, such as the 2000 US Dollar
Again, main purpose is to make accurate comparisons of measures such as GDP per capita across countries
Quantifying Changes I
Several ways we can talk about how a measure changes over time, from time t1→t2
Difference (Δ): the difference between the value at time t1 and time t2 Δt=t2−t1
Quantifying Changes II
Several ways we can talk about how a measure changes over time, from time t1→t2
Difference (Δ): the difference between the value at time t1 and time t2 Δt=t2−t1
Relative Difference: the difference expressed in terms of the original value Δtt1=t2−t1t1
this becomes a proportion (a decimal)
Quantifying Changes III
- Percentage Change (Growth Rate): relative difference expressed as a percentage
%Δ=Δtt1×100%=t2−t1t1×100%
A Simple Example Growth Rate
Example: A country's GDP is $100bn in 2019, and $120bn in 2020. Calculate the country's GDP growth rate for 2020:
The Rule of 72 I
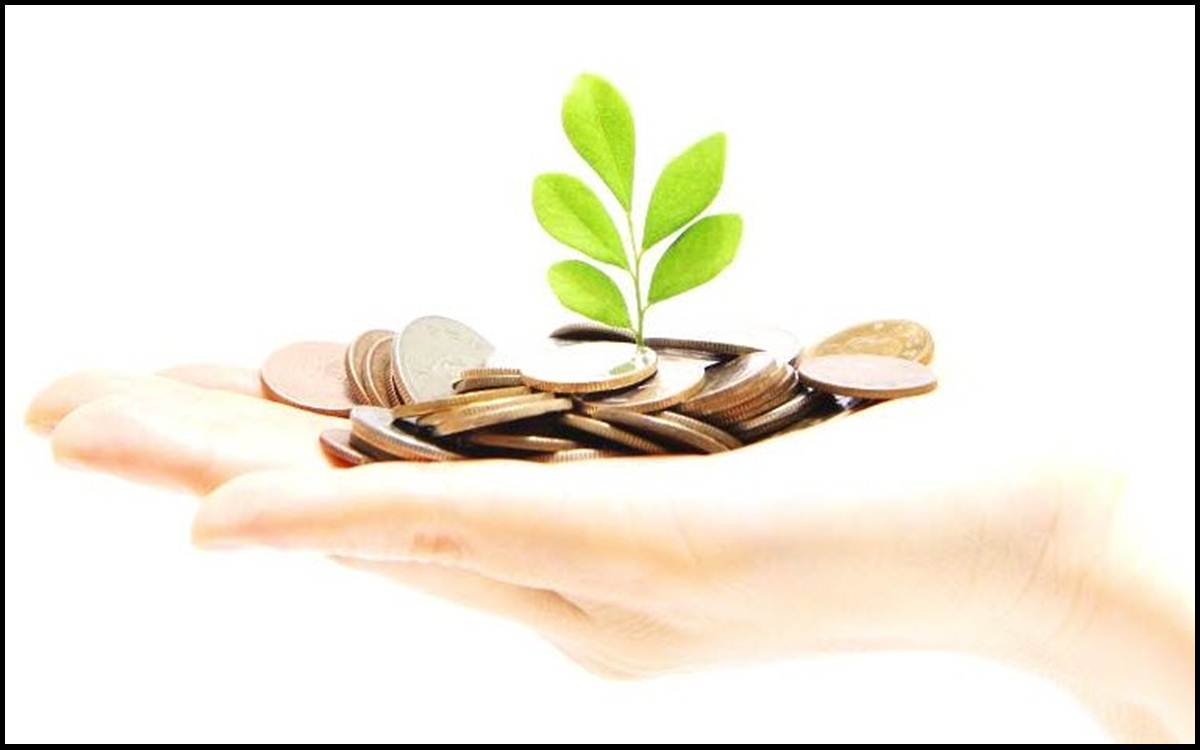
- A good rule of thumb: years for economy to double
=72GDP Growth Rate
- This is known as the Rule of 72*
* Different people use other numbers, like 70. The point is more to make mental calculations easily rather than accurately.
The Rule of 72 II
Example:
- If our economy is growing at 2% per year, the economy doubles in 722=36 years
The Rule of 72 II
Example:
If our economy is growing at 2% per year, the economy doubles in 722=36 years
If our economy is growing at 3% per year, the economy doubles in 723=24 years
The Rule of 72 II
Example:
If our economy is growing at 2% per year, the economy doubles in 722=36 years
If our economy is growing at 3% per year, the economy doubles in 723=24 years
If our economy is growing at 4% per year, the economy doubles in 724=18 years
The Rule of 72 II
Example:
If our economy is growing at 2% per year, the economy doubles in 722=36 years
If our economy is growing at 3% per year, the economy doubles in 723=24 years
If our economy is growing at 4% per year, the economy doubles in 724=18 years
If our economy is growing at 6% per year, the economy doubles in 726=12 years
The Rule of 72 III
Growth rates are unbelievably important!
It makes all the difference in the world if we grow at 2% vs. 3% per year
- Our economy would double in size in 36 vs. 24 years!
More importantly, growth compounds!
- A 2% increase from 100 is an increase of 2
- A 2% increase from 1000 is an increase of 20!

The Rule of 72 IV
Example: Suppose 2 countries start with the same GDP of $1 Trillion
- Country A grows at 2% per year
Country B grows at 4% per year
After 72 years:
- Country A doubles twice ($4 Trillion)
- Country B doubles four times ($16 Trillion)
- Country B is 4x as wealthy as Country A!

Limitations of GDP: Things Not Measured
GDP is a good but (like every other measure) an imperfect measure for social welfare and standard of living
Things NOT included in GDP:
- Increase in leisure time
- Social media, digital networks (aside from advertising)
- Increase in nonmarket or domestic activities (housework, unpaid child care)


Limitations of GDP: Quality Improvements?
- How do we measure improvements in quality, or new innovations?

Limitations of GDP: Shadow Economies I
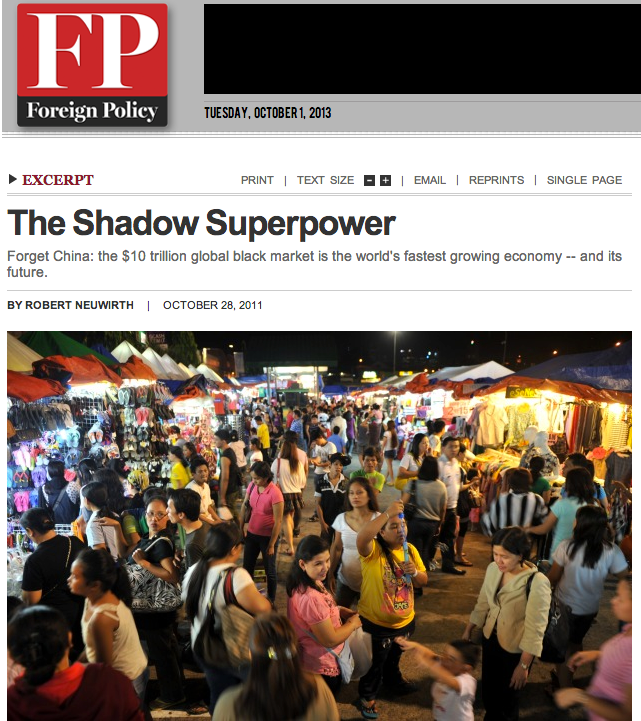
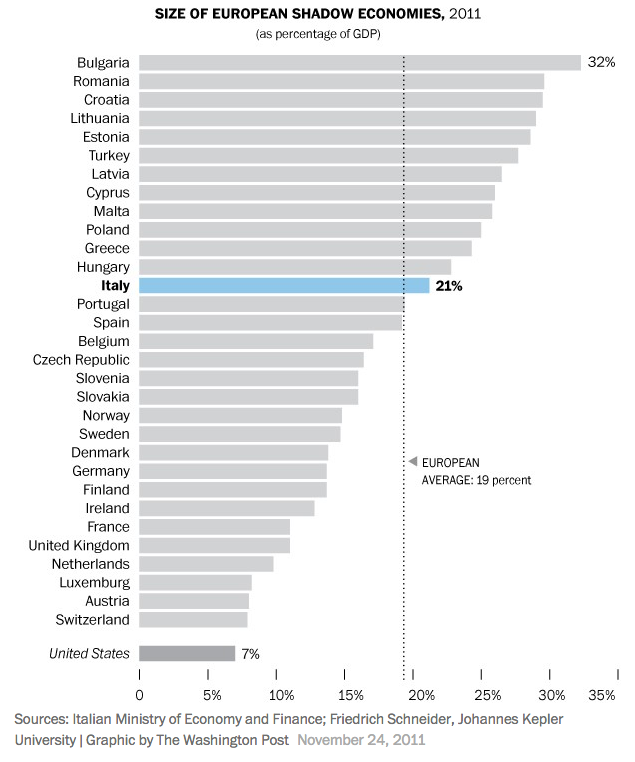
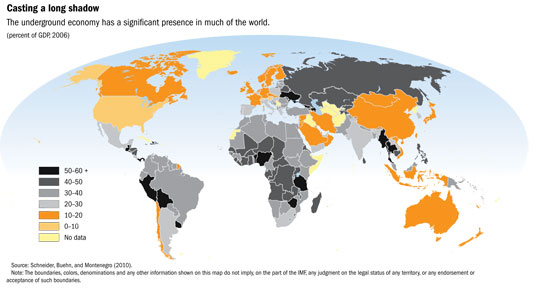
GDP by definition cannot measure the shadow economy or the "informal sector"
A major component of developing countries' economies
Staggering numbers, % of recorded GDP:
- Nigeria 1989-1990: 76%
- Thailand 1989-1990: 71%
- Russia 1994-1995: 41%
- Norway 1989-1990: 9%

Schneider, Friedrich and Dominik H. Enste, 2000, "Shadow Economies: Sizes, Causes, and Consequences," Journal of Economic Literature 37(1): 77-114
Limitations of GDP: Shadow Economies II
Don't just think crime, drugs, and human trafficking!
For various reasons, many citizens of many countries do not have access to legal markets for goods and services
Resort to informal economies and black markets to exchange goods and services
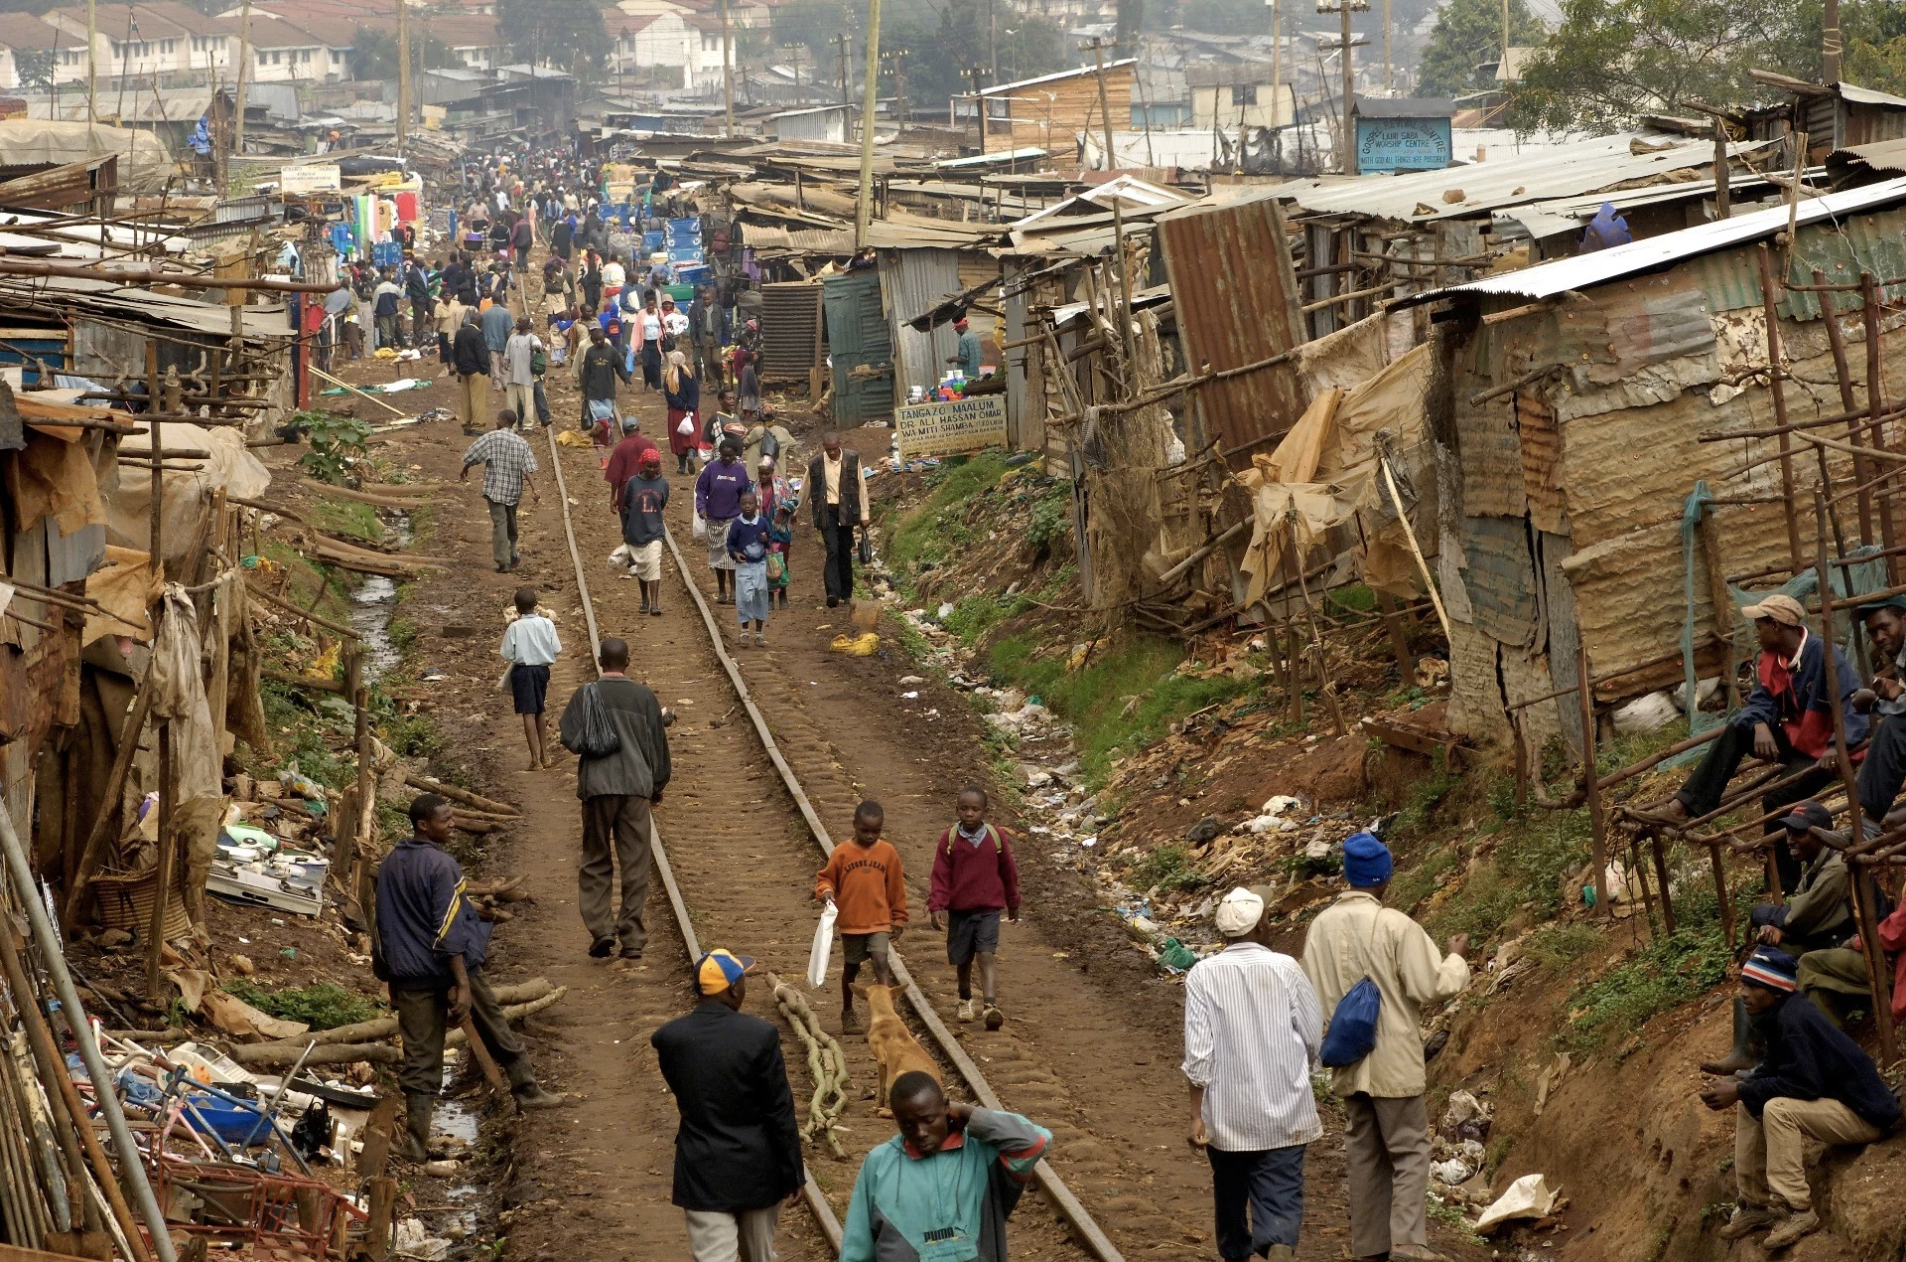
Limitations of GDP: Shadow Economies II

A typical grocery store in Vilnius, Soviet-controlled Lithuania, 1990
The list of scarce items is practically endless. They are not permanently out of stock, but their appearance is unpredictable...Leningrad can be overstocked with cross-country skis and yet go several months without soap for washing dishes. In the Armenian capital of Yerevan, I found an ample supply of accordians but local people complained that they had gone for weeks without ordinary kitchen spoons or tea samovars. I knew a Moscow family that spent a frantic month hunting for a child’s potty while radios were a glut on the market...
In an economy of chronic shortages and carefully parceled-out privileges, blat is an essential lubricant of life. The more rank and power one has, the more blat one normally has ... each has access to things or services that are hard to get and that other people want or need.
Consumers: The Art of Queuing, in The Russians
Smith, Hedrick, 1976, The Russians
Limitations of GDP: Shadow Economies III
Smith, Hedrick, 1976, The Russians
Limitations of GDP: Compared to What?
Again, GDP is a flawed measure
But remember, economists always ask, "compared to what?"
You will see later on that variation in GDP between countries and over time strongly explain variation in other measures we care about

